

Madison R. Durbin, Lindsay R. Pelcher, Sara J. McClelland, Sarah K. Woodley
Department of Biological Sciences, Duquesne University, 600 Forbes Avenue, Pittsburgh PA, 15217
Department of Biological Sciences, Moravian College, 1200 Main St., Bethlehem, PA 18018
ABSTRACT
Fetal alcohol exposure (FAE) in humans may lead to a lifetime of developmental deficits ranging from mild to severe. These defects are largely dependent on timing and consistency of alcohol exposure. The majority of FAE experiments examine moderate to heavy alcohol exposure, while fewer studies examine responses to lower levels of alcohol consumption on development. Here, we tested the effects of relatively mild ethanol exposure on development, behavior, and hormone levels in Northern Leopard Frog (Lithobates pipiens) tadpoles. Tadpoles are a useful model to study post-embryonic growth because they develop outside of the mother where alcohol exposure is relatively easy to control. The objective of our study was to determine if relatively mild ethanol exposure had adverse effects on development. We hypothesized that mild ethanol exposure during post-embryonic period will cause adverse physiological and behavioral effects and we predicted that ethanol-exposed tadpoles would exhibit higher corticosterone levels, decreased body size and mouth width, and alterations in behavior. Over four weeks, we exposed tadpoles to different ethanol concentrations: 0.009 percent, and 0.4 percent ethanol. Controls were not exposed to ethanol. Tadpoles exposed to ethanol had elevated corticosterone levels, suggesting increased stress levels. Ethanol exposure (0.4 percent) decreased mouth width as expected but surprisingly increased body mass. There were no significant results of our behavior testing. This research suggests that even at low levels of ethanol exposure, some adverse effects are measurable.
INTRODUCTION
Fetal alcohol exposure (FAE) can result in an array of developmental disorders in humans. This is concerning because women do not always know when they are pregnant, with 1 in 475 pregnant women in denial of pregnancy until 20 weeks of gestation (Jenkins et al., 2011). Additionally, an estimated 10 percent of women in the United States drink alcohol while pregnant (Tan et al., 2015). Therefore, at varying levels, human fetuses are exposed to alcohol with or without the mother’s awareness. Alcohol is a teratogen that can readily permeate the placenta, causing direct harm to fetal development (Popova et al., 2017). The severity of FAE disorders is largely dependent on timing and consistency of alcohol exposure to the human fetus (Rouzer et al., 2017). Specifically, some studies show that FAE effects are greater or categorically different when alcohol exposure occurs in early development, or the first trimester for a mother, rather than in later development (Muralidharan et al., 2013). High alcohol consumption over all three trimesters correlated with the greatest possibility of developing a FAE disorder (May et al., 2013).
Fetal alcohol syndrome (FAS), a more severe FAE disorder, results from heavy alcohol use while pregnant. Standard diagnostic criteria of FAS include appearance of a smooth philtrum (medial cleft in the upper lip), thin upper lip, small eyes, growth deficiency and functional central nervous system (CNS) abnormalities (Bertrand et al., 2004). Additional side effects include microcephaly, flattened nose, and learning disabilities. Behaviorally, people with FAS show hyperactivity, cognitive impairment, slower development than their peers, social behavior deficits, and abnormal emotional processing (Fernandes et al., 2015). While the physiological, behavioral, and neurological defects range in severity, they have lifelong implications such as attention problems, poor arithmetic skills, and trouble understanding social cues (Fernandes et al., 2015).
Most FAE experiments examine the effects of moderate to heavy alcohol exposure on the fetus (Valenzuela et al., 2012). Fewer studies examine the effects of lower levels of alcohol consumption on development and behavior. In fact, one study suggested that low amounts of fetal ethanol exposure are tolerable, because the body can dispose of toxins, and changes in somatic growth were seen only when exposure reached a minimum threshold dose (Jacobson et al., 1994). However, other measures of health may be more sensitive to lower levels. Also, the majority of pregnant women may not be heavy drinkers but may think it is safe to consume a glass of wine on occasion (Bay et al., 2012; Kelly et al., 2012). For these reasons, it is important to know if low or infrequent alcohol consumption poses any risk for developing offspring (Mamluk et al., 2017).
Animal models can help us understand how exposure to varying concentrations of ethanol at different times during development can affect the severity of behavioral and physical effects caused by FAE (Rouzer et al., 2017). Vertebrate model organisms are crucial in characterizing effects of FAE because of the genetic and morphological similarity to humans (Fainsod and Kot-Leibovich, 2018). Several studies have utilized tadpole models to investigate physical effects and molecular processes of FAE as well as the etiology of craniofacial disorders in relation to human craniofacial development and disorder (Nakatsuji et al., 1983; Peng et al., 2004; Dubey and Saint-Jeannet, 2017; Fainsod and Kot-Leibovich, 2018). In addition, tadpoles are a potentially useful model for studying post-embryonic growth because, unlike rodent models that develop in utero, tadpoles develop outside of the mother. Thus, it is relatively easy to control the alcohol exposure.
To determine the effects of relatively mild ethanol exposure on vertebrate development, Lithobates pipiens (Northern Leopard Frog) tadpoles were exposed to low levels of ethanol. In humans, low ethanol exposure is classified as less than 70 g of alcohol per week, with about 10 – 20 g of alcohol per occasion (one standard drink = 10 g of alcohol) (Rostand et al., 1990); O’Leary et al., 2010) . Tadpoles were exposed once weekly in early development to mimic episodic alcohol consumption during the first trimester of fetal development. The chosen dosage (see methods) corresponds to relatively low alcohol consumption in humans.
We hypothesized that low ethanol exposure during post-embryonic development would elicit effects on growth, development, activity, anxiety, hormone levels (corticosterone, CORT), and brain and body morphology including mouth width. Other studies have shown that growth and development are delayed with FAE, activity and anxiety are altered with FAE, and CORT is elevated in response to stressors (Rostand et al., 1990; Hossie et al., 2010; Mathur and Guo, 2011; Crespi and Warne, 2013; Murawski et al., 2015) . FAE has also been shown to have effects on on craniofacial morphology (Nakatsuji, 1983). Brain and body morphology were measured because these traits are plastic and sensitive to environmental stimuli (Woodley et al., 2015; McClelland et al., 2018).

METHODS
Animal Husbandry
Northern Leopard Frog (Lithobates pipiens) egg masses were purchased from Nasco (Fort Atkinson, WI) and housed in 15L Sterilite™ plastic bins (42.5 cm x 30.2 cm x 17.8 cm) containing 5 L of water. Six days post-hatching, tadpoles were distributed haphazardly into 8 bins (7 tadpoles / 5 L) and were kept at room temperature (22ºC +/- 1ºC) on a 12L:12D light cycle (Table 1). Tadpoles were not weighed at this time because it is difficult to get an accurate measure of body mass at this early stage of development without harming the tadpoles. All water was passed through carbon and sediment filters and UV irradiated prior to use. Water conditioner was applied to remove chlorine and chloramines. Bins were aerated with an air and stone pump to provide gentle airflow. Tadpoles were fed approximately 10 – 15 percent of their body mass with Nasco Xenopus food three times a week. A daily log was kept monitoring time and amounts of feeding (0.1 g – 0.7 g), water temperature (19ºC +/- 1ºC), and tadpole appearance. Water was changed twice a week and waste was suctioned out as needed, once or twice a week, between water changes. All protocols were approved by Duquesne University’s Institutional Animal Care and Use Committee.
Treatments
Ten days after hatching, at Gosner stage 25 (Gosner, 1960), bins containing tadpoles were subjected to one of three treatments: control that was filtered water only, 0.009 percent ethanol, and 0.4 percent ethanol. The LC50 for embryonic African Clawed frogs (Xenopus laevis) is 1.58 percent, and the no observable effect level (NOEL) for malformations is 1 percent (Dresser et al., 1992). Thus, we considered a 0.4 percent dose in post-embryonic tadpoles to be a suitable concentration to simulate relatively low FAE. The 0.009 percent concentration was selected to represent a lower ethanol concentration.
Treatment began on day 1, and bins were re-treated on days 8, 15, and 22 (Table 1). Stock solutions were prepared with ethyl alcohol 200 proof (Pharmco, Cat. No. 111000200) and made such that when added to 5 L water in bins, the correct ethanol concentration was achieved. The experiment was a blind study; the bins and stock solutions were color coded per treatment and assigned by an outside person. Treatment bins were distributed evenly among shelves to minimize environmental biases.
There were 7 tadpoles per bin, with 4 bins per treatment. To avoid pseudoreplication, responses across tadpoles for most endpoints were averaged within each bin such that the samples sizes were 4 bins per treatment. However, for behavior and CORT, one tadpole per bin was haphazardly selected and tested
Waterborne Corticosterone
To assess CORT in a noninvasive manner, CORT was measured in the water that housed the tadpoles. The use of waterborne CORT as an indicator of body CORT has been validated in tadpoles (Forsburg et al., 2019).
After 24 days of treatment, one large tadpole from each bin was haphazardly selected and gently transferred using a net into a large plastic tripour beaker containing 75mL of filtered tap water (Table 1). The tadpole was left in the beaker for 1 hour, then it was removed and weighed, and the water was saved. Negative control samples (3) were beakers with filtered tap water and no tadpole. Whatman Grade 1 filter paper and glass funnels were used to filter out any particulate matter. About 10mL of sample was collected in a 15mL sterile Falcon tube and frozen at -20ºC for 6 months until solid phase extraction.
Samples were purified and enriched for steroids using solid phase extraction. After thawing, samples were added to Sep-pak C18 cartridges (Waters Corp. WAT054945) that had been primed with HPLC grade methanol. A vacuum was attached to obtain a drip rate of 1 drip per 2 seconds and was stopped before drying the sorbent out. Next, the hormones were eluted from the cartridges into glass test tubes using two passes of 2ml HPLC grade methanol. The methanol was evaporated off in a fume hood by placing the samples in a water bath of 45ºC and under a gentle stream of N2 gas. After the methanol was completely evaporated, the sample was resuspended in 95 percent ELISA buffer and 5 percent EtOH. Test tubes were vortexed, covered with parafilm, and stored at -20ºC for 5 days.
A corticosterone ELISA kit was used to measure corticosterone levels in water samples (Cayman Chemical, No. 501320) following kit directions. Values for the negative controls (which were all lower than tadpole samples) were subtracted from the values representing the tadpole samples prior to analysis.
Behavioral Assays
After 29 days of treatment, behavior tests were conducted to measure behaviors reflective of anxiety (Table 1): activity and boldness in the absence of a stimulus, responses to a novel item, and responses to kairomones (predator cues). Twelve tadpoles total, one from each bin, were used in behavioral assays. One hour before behavior assays, a single representative tadpole from each bin was haphazardly selected and transferred to a plastic testing bin (Nasco, 28.5 cm x 18 cm x 12 cm) containing 3 L of filtered tap water. A paper grid with nine sections was under each bin to allow us to measure tadpole movement and location within each bin. Logitech C170 Webcams connected to computers were used to take videos of the behavioral assays.
Baseline behavior (activity and boldness) was measured using an open field test. Before beginning, water was added to the bins to control for the act of adding kairomones in a later behavioral assay. Behavior was recorded for 15 minutes. Second, to test responses to novelty, tongs were used to add a three-inch magnetic marble with colored magnet attachment (novel stimulus) into one assigned corner of each tadpole bin (corners were randomized among the treatments). Video recordings were taken for 15 minutes after which the novel stimulus was gently removed with magnetic bars. Finally, responses to predatory kairomone were measured. After a 10-minute acclimation period, 10 mL of kairomone were added to bins. The kairomone consisted of water taken from an aquarium housing a red-eared slider turtle, a natural predator to tadpoles. Behavior was recorded for 20 minutes.
Videos were later observed to examine location relative to the grid and time spent in the center of the field. The total number of line crossings over a 10 minute interval were counted for both the open field and kairomone tests. Seconds spent in center were observed in the open field (center), and seconds spent in novelty item quadrant were observed for the novelty stimulus. Each video was scored by four different observers and results were averaged.
Euthanasia and Imaging
After 30 days from the start of treatment, tadpoles were euthanized by placing them in tricaine methanesulphonate (MS222: 250 mg/L, Fisher NCO135573) for 10 minutes (Table 1). Euthanized tadpoles were rinsed, blotted dry, weighed, and placed in 10 – 20 mL of neutral buffered formalin fixative. After 24 hours, the fixative was poured off and the carcasses were rinsed with water, blotted dry, and weighed again. Each tadpole was examined under a dissection microscope to determine Gosner stage. Dorsal and ventral images were taken of tadpole carcasses with Canon PowerShot (12.1 Megapixels). To measure mouth size, tadpoles were positioned in a foam apparatus to lay flat and one image per tadpole was taken with an Olympus SZ61 microscope camera. Finally, brains were removed, blotted dry, and weighed. Dorsal and ventral views of each brain was imaged three separate times with an Olympus DP70 Microscope Digital Camera.

Figure 1. Morphology of tadpole mouth. a) Ventral view of tadpole. b) Magnification of boxed area in a, showing the keratinized upper and lower jaw sheaths. A yellow line is drawn under the upper jaw sheath to show what was measured. c) Line drawing showing mouth anatomy with yellow line depicting the linear dimension of the upper jaw sheath. All photo credits and line drawings are by MD.
Image Analysis

Figure 2. Contrary to expectations, body mass was larger in tadpoles exposed to ethanol (F2,9 = 5.85, p = 0.024). Groups that share a letter are not significantly different (post-hoc pairwise comparison tests, p > 0.05, see text for details). Sample sizes are 4 bins per treatment.
Linear dimensions of brain and body morphology were measured with Image J (Rueden et al., 2017) following previous methods (Woodley et al., 2015). Measurements were taken for telencephalon width, telencephalon length, optic tectum length, optic tectum width, diencephalon width, diencephalon length, and medulla width. Each image was measured by two observers and values were averaged. Dorsal and lateral images of tadpoles were analyzed by a single observer to measure body length, body depth, muscle depth, tail length, tail depth, body width, tail width and length of the upper jaw sheath (Figure 1). Because data were collected from each of three images for each brain, the measurements were averaged prior to inferential statistics.
Statistical Analysis
To avoid pseudoreplication, responses across tadpoles within each bin were averaged such that samples sizes were 4 bins per treatment for most endpoints. For behavior and CORT, sample sizes were 1 tadpole per bin, for a total of 4 tadpoles per treatment. Sample sizes of 4 replicates per treatment have been used previously to show effects of trace levels of pesticides on tadpole development (Woodley et al., 2015; McClelland et al., 2018).
Data were analyzed using SPSS Version 25. The threshold for significance was p < 0.05. We confirmed that data satisfied assumptions of the tests we used (e.g., homogeneity of variances and normality for ANOVAs). In several analyses, we included body mass as a covariate because body dimensions are expected to increase as body mass increases.
When analyzing multiple dependent variables that are likely to be highly correlated, like brain and body dimensions, one approach is to reduce the number of factors by conducting a principal components analysis (PCA). Thus, brain measurements (corrected for brain mass) were analyzed using a PCA (Woodley et al., 2015). However, body measurements were not analyzed with a PCA because assumptions of PCA (as indicated by Kaiser-Meyer-Olkin and Bartlett’s tests) were violated. Instead, body measurements were analyzing using ANOVA with body mass as a covariate.
The other dependent variables were analyzed using one-way ANOVAs to test for treatment effects. If statistically significant differences were found with the one-way ANOVA, pairwise comparisons were made using least significant difference (LSD), correcting our threshold for significance depending on the number of pairwise comparisons. Because the waterborne corticosterone data were not normally distributed due to one value being very high compared to the others, they were analyzed with nonparametic Kruskal-Wallis and Mann-Whitney U tests.

RESULTS
None of the tadpoles in the control bins died over the course of the experiment. One tadpole per bin in three out of the four bins with 0.009 percent ethanol treatment died. One tadpole per bin in two bins with 0.4 percent ethanol treatment died, and two tadpoles in one bin treated with 0.4 percent ethanol died. These differences were marginally statistically significant (Table 2, F2,9 = 3.55, p = 0.073).
Body mass measured at the end of the experiment varied according to treatment (Figure 2, F2,9 = 5.85, p = 0.024). Tadpoles exposed to 0.4 percent ethanol were significantly larger than the controls (LSD tests, with alpha corrected for the number of tests performed). Developmental stage was not different among groups (Table 2, F2,9 = 2.89, p = 0.11). Furthermore, individual body measurements, corrected for differences in body mass, did not differ among treatment groups (Table 3).
Brain mass, corrected for body mass, did not differ among treatment groups (Table 2, F2,8 = 1.77, p = 0.23). The brain shape PCA identified one principal component that explained 78 percent of the variance in the mass-adjusted brain measurements; however, there was no effect of treatment on brain shape (F2,8 = 0.34, p = 0.72).
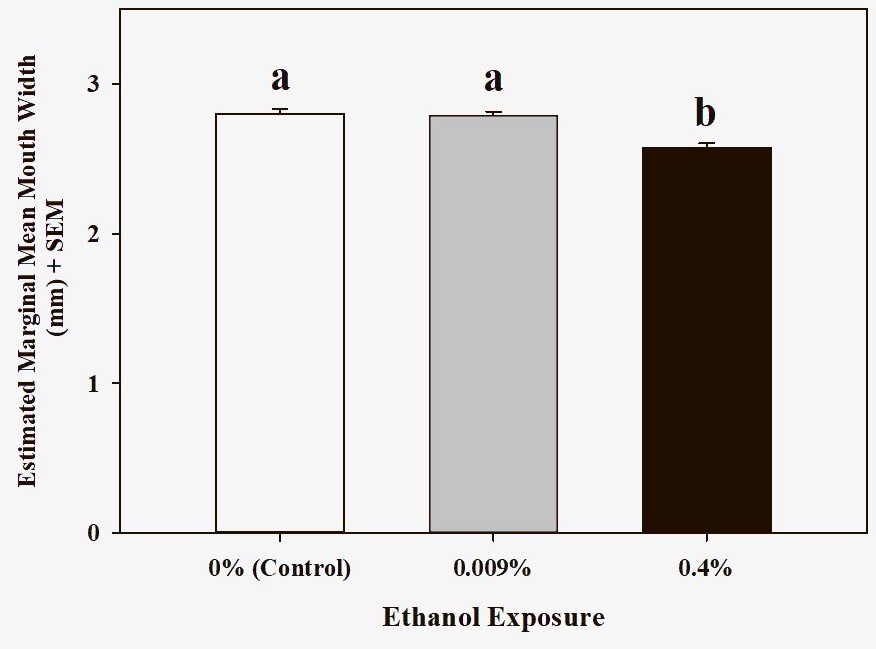
Figure 3. Mouth width (corrected for differences in body mass) was smaller in tadpoles exposed to 0.4 percent ethanol (F2,8 = 13.85, p = 0.003). Groups that share a letter are not significantly different (post-hoc pairwise comparison tests, p > 0.05,. Sample sizes are bins per treatment.
Average mouth width (upper jaw sheath), corrected for difference in body mass, varied according to treatment (Figure 3, F2,8 = 13.85, p = 0.003). Relative mouth width was smallest in tadpoles exposed to 0.4 percent ethanol compared to the other groups (LSD post hoc tests: versus control, p = 0.003; versus 0.009 percent ethanol, p = 0.003). Percent change in mouth width from control to 0.4 percent ethanol exposure groups was 8.19 percent.

Figure 4. Water-borne corticosterone levels were higher in tadpoles exposed to 0.4 percent ethanol. Groups that share a letter are not significantly different (post-hoc pairwise comparison tests, p > 0.05, see text for details). Sample sizes are 4 tadpoles (one from each bin) per treatment.
Water-borne corticosterone levels varied according to treatment groups (mean ± SEM control: 3.9 ± 0.87; 0.009 percent ethanol: 3.5 4 ± 1.37; 0.4 percent ethanol: 18.98 ± 11.72) (Kruskal-Wallis test, chi-square = 6.5, df = 2, p = 0.038). Water-borne corticosterone was higher in beakers containing tadpoles exposed to 0.4 percent ethanol compared to the control group (Figure 4, Mann Whitney U = 0, p = 0.021). There were no effects of treatment on behavioral measurements other than a marginally statistically significant increase in responses to a novel stimulus (Table 2, F2,9 = 3.69, p = 0.068).
DISCUSSION
Our study focused on the effects of relatively low ethanol exposure on a developing fetus using a larval amphibian model. Our hypothesis that exposure at low levels of ethanol during the post-embryonic period would cause physiological, morphological, and behavioral effects was partially supported. Weekly exposure to a 0.4 percent concentration of ethanol had an effect on body mass and mouth width. Likewise, 0.4 percent ethanol exposure corresponded to changes in corticosterone levels, suggesting increased stress levels with a relatively low ethanol concentration. However, there were no effects of low ethanol exposure during early development on developmental stage, body morphology, brain morphology, or behavior. Results are discussed in more detail below.
Body mass was greater in tadpoles exposed to 0.4 percent ethanol compared to control tadpoles. Traditionally, ethanol exposure is understood to limit fetal development and growth (Day et al., 1989; Gundogan et al., 2015; Carter et al., 2016). Our unexpected result on body mass could be related to the marginally significant effect of ethanol on survival, with slightly more tadpoles dying in the presence of ethanol. Because most of the mortality occurred early in the study, the density of tadpoles differed slightly among the treatments, which may have caused the body mass differences. Food distribution was adjusted based on tadpole density, therefore all tadpoles received access to the same amount of food, but there could have been other density-related effects. In other studies of larval amphibians, higher densities are associated with smaller body sizes (Berven and Chadra, 1988; Gillespie, 2002; Relyea, 2002). In addition, it is possible that the tadpoles that died in the ethanol exposure groups were the smaller tadpoles, thereby biasing the results towards the survivors, which may have been larger animals on average.
Interestingly, the upper jaw sheath width was about 8 percent smaller in tadpoles exposed to 0.4 percent ethanol. A decrease in mouth width with 0.4 percent ethanol exposure could indicate craniofacial underdevelopment. Other studies have detailed mouth width size reduction with elevated ethanol levels as a relatable feature of human infants with FAS (Nakatsuji, 1983). Our data suggests that even at low level exposure, this teratogenic effect was still measurable. The decreased mouth width apparently did not affect feeding and growth, since this group of tadpoles had higher overall body mass.
There was no effect of ethanol treatment on body morphology, brain mass, or brain morphology. Other studies have shown that the development of these traits is plastic. For example, exposure to predator cues altered tadpole body shape (Gonda et al., 2010; Woodley et al., 2015) and exposure to low levels of pesticides altered tadpole brain shape (Woodley et al., 2015, McClelland et al., 2018). Thus, the ethanol exposure regimen did not alter these plastic traits. These results are important for studies of pesticides on development because ethanol (typically around 0.009 percent concentration) is the vehicle for pesticide delivery (Woodley et al., 2015, McClelland et al., 2018). Our results suggest that the ethanol vehicle does not contribute to potential pesticide effects on brain and body morphology.
Higher waterborne corticosterone levels from tadpoles of the 0.4 percent ethanol exposure is consistent with ethanol exposure activating the endocrine stress axis as has been found in rats and humans (Lovallo, 2006). In tadpoles, elevated CORT is associated with increased locomotory activity (Middlemis Maher et al., 2013). However, there were no effects of treatment on activity or our other behavioral assays. Our results contrast with a similar study where acute ethanol exposure in zebrafish exhibited dose-dependent anxiety effects (Mathur and Guo, 2011). Thus, our behavioral assays may not have been accurate or sensitive enough to measure behavioral abnormalities.
In summary, decreased jaw sheath width and increased corticosterone levels were found after relatively mild ethanol exposure using a tadpole model. This research suggests that low levels of ethanol exposure have adverse effects on vertebrate development, contradicting some previous studies that showed minimal effects. Our research fits into the larger field of research by suggesting that there are measurable impacts of ethanol exposure which warrant additional investigation. Given the fact that many women consume low levels of alcohol during pregnancy, it is imperative to study effects of relatively low levels of ethanol exposure on vertebrate development.
ACKNOWLEDGMENTS
We thank the Duquesne University undergraduate students of the Cell and Systems Physiology Laboratory course for helping carry out this experiment. Funding was provided by the Department of Biological Sciences, Duquesne University.
REFERENCES
Bay, B., Stovring, H., Wimberley, T., Denny, C. H., Mortensen, E. L., Eriksen, H. L. F., and Kesmodel, U. S. (2012). Low to moderate alcohol intake during pregnancy and risk of psychomotor deficits. Alcoholism: Clinical and experimental research, 36(5), 807-814. available: 10.1111/j.1530-0277.2011.01657.x.
Bertrand, J., Floyd, R., Weber, M., O’Connor, M., Riley, E., Johnson, K., and Cohen, D. (2004). National Task Force on FAS/FAE. Fetal Alcohol Syndrome: Guidelines for Referral and Diagnosis. Atlanta, GA: Centers for Disease Control and Prevention.
Berven, K. A., and Chadra, B. G. (1988). The relationship among egg size, density and food level on larval development in the wood frog (Rana sylvatica). Oecologia, 75, 67-72. available: 10.1007/BF00378815.
Carter, R. C., Jacobson, J. L., Molteno, C. D., Dodge, N. C., Meintjes, E. M., and Jacobson, S. W. (2016). Fetal alcohol growth restriction and cognitive impairment. Pediatrics, 138(2). available: 10.1542/peds.2016-0775
Crespi, E. J., and Warne, R. W. (2013). Environmental conditions experienced during the tadpole stage alter post-metamorphic glucocorticoid response to stress in an amphibian. Integrative and Comparative Biology, 53(6), 989-1001. available: 10.1093/icb/ict087
Day, N. L., Jasperse, D., Richardson, G., Robles, N., Sambamoorthi, U., Taylor, P., Scher, M., Stoffer, D., and Cornelius, M. (1989). Prenatal exposure to alcohol: effect on infant growth and morphologic characteristics. Pediatrics, 84(3), 536-541.
Dresser, T. H., Rivera, E. R., Hoffmann, F. J., and Finch, R. A. (1992). Teratogenic assessment of four solvents using the Frog Embryo Teratogenesis Assay--Xenopus (FETAX). Journal of Applied Toxicology, 12(1), 49-56.
Dubey, A., and Saint-Jeannet, J. P. (2017). Modeling human craniofacial disorders in Xenopus. Current pathobiology reports, 5(1), 79-92. available: 10.1007/s40139-017-0128-8.
Fainsod, A., and Kot-Leibovich, H. (2018). Xenopus embryos to study fetal alcohol syndrome, a model for environmental teratogenesis. Biochemistry and Cell Biology, 96(2), 77-87. available: 10.1139/bcb-2017-0219
Fernandes, Y., Rampersad, M., and Gerlai, A. R. (2015). Impairment of social behaviour persists two years after embryonic alcohol exposure in zebrafish: A model of fetal alcohol spectrum disorders. Behavioral Brain Research, 292, 102-108. available: 10.1016/j.bbr.2015.05.060
Forsburg, Z. R., Goff, C. B., Perkins, H. R., Robicheaux, J. A., Almond, G. F., and Gabor, C. R. (2019). Validation of water-borne cortisol and corticosterone in tadpoles: Recovery rate from an acute stressor, repeatability, and evaluating rearing methods. General and Comparative Endocrinology, 281, 145-152. available: 10.1016/j.ygcen.2019.06.007
Gillespie, G. R. (2002). Impacts of sediment loads, tadpole density, and food type on the growth and development of tadpoles of the spotted tree frog Litoria spenceri: an in-stream experiment. Biological Conservation, 106, 141-150. available: 10.1016/S0006-3207(01)00127-6.Gosner, K. L. (1960). A simplified table for staging anuran embryos and larvae with notes on identification. Herpetologica, 16(3), 183-190.
Gundogan, F., Gilligan, J., Qi, W., Chen, E., Naram, R., and de la Monte, S. M. (2015). Dose effect of gestational ethanol exposure on placentation and fetal growth. Placenta, 36(5), 523-530. available: 10.1016/j.placenta.2015.02.010
Hossie, T. J., Ferland-Raymond, B., Burness, G., and Murray, D. L. (2010). Morphological and behavioural responses of frog tadpoles to perceived predation risk: A possible role for corticosterone mediation? Ecoscience, 17, 100-108. available: 10.2980/17-1-3312
Jacobson, J. L., Jacobson, S. W., and Sokol, R. J. (1994). Effects of prenatal exposure to alcohol, smoking, and illicit drugs on postpartum somatic growth. Alcoholism: Clinical and Experimental Research, 18(2), 317-323. available: 10.1111/j.1530-0277.1994.tb00020.x.
Jenkins, A., Millar, S., and Robins, J. (2011). Denial of pregnancy-a literature review and discussion of ethical and legal issues. Journal of the royal society of medicine, 104(7), 286-291. available: 10.1258/jrsm.2011.100376.
Kelly, Y. J., Sacker, A., Gray, R., Kelly, J., Wolke, D., Head, J., and Quigley, M. A. (2012). Light drinking during pregnancy: still no increased risk for socioemotional difficulties or cognitive deficits at 5 years of age? Journal of Epidemiololgy and Community Health, 66(1), 41-48. available: 10.1136/jech.2009.103002.
Lovallo, W. R. (2006). Cortisol secretion patterns in addiction and addiction risk. International Journal Psychophysiology, 59(3), 195-202. available: 10.1016/j.ijpsycho.2005.10.007
Mamluk, L., Edwards, H. B., Savovic, J., Leach, V., Jones, T., Moore, T. H. M., Ijaz, S., Lewis, S. J., Donovan, J. L., Lawlor, D., Smith, G. D., Fraser, A., and Zuccolo, L. (2017). Low alcohol consumption and pregnancy and childhood outcomes: time to change guidelines indicating apparently ‘safe’ levels of alcohol during pregnancy? A systematic review and meta-analyses. BMJ Open, 7(7), e015410. available: 10.1136/bmjopen-2016-015410
Mathur, P., and Guo, S. (2011). Differences of acute versus chronic ethanol exposure on anxiety-like behavioral responses in zebrafish. Behavioral Brain Research, 219(2), 234-239. available: 10.1016/j.bbr.2011.01.019
May, P. A., Blankenship, J., Marais, A. S., Gossage, J. P., Kalberg, W. O., Joubert, B., Cloete, M., Barnard, R., De Vries, M., Hasken, J., Robinson, L. K., Adnams, C. M., Buckley, D., Manning, M., Parry, C. D., Hoyme, H. E., Tabachnick, B., and Seedat, S. (2013). Maternal alcohol consumption producing fetal alcohol spectrum disorders (FASD): quantity, frequency, and timing of drinking. Drug Alcohol Dependency, 133(2), 502-512. available: 10.1016/j.drugalcdep.2013.07.013
McClelland, S. J., Bendis, R. J., Relyea, R. A., and Woodley, S. K. (2018). Insecticide-induced changes in amphibian brains: How sublethal concentrations of chlorpyrifos directly affect neurodevelopment. Environmental Toxicology and Chemistry, 37(10), 2692-2698. available: 10.1002/etc.4240
Middlemis Maher, J., Werner, E. E., and Denver, R. J. (2013). Stress hormones mediate predator-induced phenotypic plasticity in amphibian tadpoles. Proceedings Biological Sciences, 280(1758), 20123075. available: rspb.2012.3075 [pii] 10.1098/rspb.2012.3075
Muralidharan, P., Sarmah, S., Zhou, F. C., and Marrs, J. A. (2013). Fetal alcohol spectrum disorder (FASD) associated neural defects: Complex mechanisms and potential therapeutic targets. Brain Science, 3(2), 964-991. available: 10.3390/brainsci3020964
Murawski, N. J., Moore, E. M., Thomas, J. D., and Riley, E. P. (2015). Advances in diagnosis and treatment of fetal alcohol spectrum disorders: From animal models to human studies. Alcohol Research, 37(1), 97-108.
Nakatsuji, N. (1983). Craniofacial malformation in Xenopus laevis tadpoles caused by the exposure of early embryos to ethanol. Teratology, 28(2), 299-305. available: 10.1002/tera.1420280220
O’Leary, C. M., Bower, C., Zubrick, S. R., Geelhoed, E., Kurinczuk, J. J., and Nassar, N. (2010). A new method of prenatal alcohol classification accounting for dose, pattern and timing of exposure: improving our ability to examine fetal effects from low to moderate alcohol. Journal of Epidemiology and Community Health, 64(11), 956-962. available: 10.1136/jech.2009.091785
Peng, Y., Yang, P. H., Ng, S. S., Wong, O. G., Liu, J., He, M. L., Kung, H. F., and Lin, M. C. (2004). A critical role of Pax6 in alcohol-induced fetal microcephaly. Neurobiology of Disease, 16(2), 370-376. available: 10.1016/j.nbd.2004.03.004.
Popova, S., Lange, S., Probst, C., Gmel, G., and Rehm, J. (2017). Estimation of national, regional, and global prevalence of alcohol use during pregnancy and fetal alcohol syndrome: a systematic review and meta-analysis. Lancet Global Health, 5(3), e290-e299. available: 10.1016/S2214-109X(17)30021-9.
Relyea, R. A. (2002). Costs of phenotypic plasticity. American Naturalist, 159(3), 272-282. available: 10.1086/338540
Rostand, A., Kaminski, M., Lelong, N., Dehaene, P., Delestret, I., Klein-Bertrand, C., Querleu, D., and Crepin, G. (1990). Alcohol use in pregnancy, craniofacial features, and fetal growth. Journal of Epidemiology and Community Health, 44(4), 302-306. available: 10.1136/jech.44.4.302.
Rouzer, S. K., Cole, J. M., Johnson, J. M., Varlinskaya, E. I., and Diaz, M. R. (2017). Moderate maternal alcohol exposure on gestational Day 12 impacts anxiety-like behavior in offspring. Frontiers Behavioral Neuroscience, 11, 183. available: 10.3389/fnbeh.2017.00183.
Rueden, C. T., Schindelin, J., Hiner, M. C., DeZonia, B. E., Walter, A. E., Arena, E. T., and Eliceiri, K. W. (2017). ImageJ2: ImageJ for the next generation of scientific image data. BMC Bioinformatics, 18(1), 529. available: 10.1186/s12859-017-1934-z.
Tan, C. H., Denny, C. H., Cheal, N. E., Sniezek, J. E., and Kanny, D. (2015). Alcohol use and binge drinking among women of childbearing age - United States, 2011-2013. Morbidity and Mortality Weekly Report, 64(37), 1042-1046. available: 10.15585/mmwr.mm6437a3.
Valenzuela, C. F., Morton, R. A., Diaz, M. R., and Topper, L. (2012). Does moderate drinking harm the fetal brain? Insights from animal models. Trends in Neuroscience, 35(5), 284-292. available: 10.1016/j.tins.2012.01.006.
Woodley, S. K., Mattes, B. M., Yates, E. K., and Relyea, R. A. (2015). Exposure to sublethal concentrations of a pesticide or predator cues induces changes in brain architecture in larval amphibians. Oecologia, 179(3), 655-665. available: 10.1007/s00442-015-3386-3.