
Author: Marvin X. C. Seow
Institution: Department of Materials Science and Engineering, National University of Singapore, 9 Engineering Drive 1, Singapore 117575
doi:10.22186/jyi.31.4.7-11
ABSTRACT
Nanostructured metal alloys made up of Pt and another metal are more efficient in catalysing reactions than pure Pt nanoparticles. However, few studies have investigated low heat, solvent-free chemical deposition techniques of nanostructured metal alloys. This paper investigates the deposition of Pt–Au nanostructured metal alloy on fluorine-doped tin oxide glass via the low heat, solvent-free polyol reduction and the effect of Pt:Au mass loading ratio on the catalytic performance. The deposition process involves drop-casting the metal precursors, H2PtCl6 and HAuCl4, on the glass substrates and reducing the precursors with vaporised ethylene glycol at 170°C for 15 minutes. The scanning electron microscope revealed that the structure of Pt–Au alloy changes from three-dimensional globular nanostructures to two-dimensional triangular and hexagonal nanoplates and to three-dimensional nanocrystals as the Au concentration increases. The X-ray photoelectron spectroscopy confirmed that the precursors on glass substrates were reduced to metallic Pt and Au. The electrocatalysis of CH3OH, with the Pt–Au glass substrates as work electrodes, showed that Pt–Au alloys have better catalytic performances than those of pure Pt and the catalytic rate peaks at a certain Pt:Au mass loading ratio.
INTRODUCTION
Platinum (Pt) nanoparticles act as catalysts in proton exchange membrane (PEM) fuel cells powering machinery (Bing, Liu, Zhang, Ghosh, & Zhang, 2010; Ouyang & Cho, 2011). Using H2 or liquid fuels like CH3OH, PEM fuel cells, made up of acid-soaked PEM placed in between the anode and cathode catalyst, oxidize the fuel at the cathode and reduce the oxygen entering the cell. This creates a potential difference, V, that drives an electric current. Said electric current can be used to power a variety of applications. The fuel cell could use a Pt plate or Pt coated substrate as either the anode or cathode catalysts. It has been reported in studies that by combining Pt with other metals to form nanostructured metal alloys (NMA), the adsorption of carbonaceous poisoning species like CO is suppressed (Ren et al., 2010). Such poisoning species tend to permanently bind themselves to the catalyst, leaving less sites for the oxidation and reduction of chemical species responsible for driving the electric current. Less adsorption of poisoning species in NMA catalysts can lead to enhanced catalytic performance.
NMA can be chemically deposited on substrates in the same way as pure metal nanoparticles do. There are several deposition methods, of which the chemical reduction method is the most popular method (Herricks, Chen & Xia, 2004; Ouyang & Cho, 2011; Skrabalak, Wiley, Kim, Formo, & Xia, 2008). The chemical reduction method uses a reducing agent, such as NaBH4 and LiBEt3H, to reduce metal precursors to their pure metallic form (Gonsalvesa, Rangarajan & Wang, 2000). By controlling the experimental conditions, like the pH and precursor concentration, the shape, size and composition of NMA are well-controlled, making this method the most popular (Ouyang & Cho, 2011).
Most studies employ complex chemical reduction methods to produce NMA with high catalytic capabilities. They include heating at high temperatures over 300°C (Ganesan, Freemantle, & Obare, 2007; Jana, Dutta, Bera, & Koner, 2008) or using complicated postnanoparticle immobilisation processes like layer-by-layer deposition (Ouyang & Cho, 2011). A convenient chemical reduction method by Ouyang & Cho (2011) is the low heat, solvent-free polyol reduction. The reducing agent used is ethylene glycol (EG), which is vaporized under low heat (below 200°C) so that the vapour will reduce metal precursors. EG is then oxidized to aldehydes and carboxylic acids. Gaseous products from this reaction will escape into the air, leaving the NMA end-product free of any liquid organic compounds. The formed NMA will have well-defined shapes and good adhesion to glass substrates. Thus, no additional steps of mixing metal precursors with surfactants and additives, which control the shapes, are required.
Here we investigate the deposition of Pt–Au NMA of varying Pt:Au mass loading ratios on fluorine-doped tin oxide (FTO) glass substrates using the low heat, solvent-free polyol reduction by Ouyang & Cho (2011). We evaluate the hypothesis that the low heat, solvent-free polyol reduction method is able to produce the Pt–Au NMA that has better catalytic ability than that of pure Pt. We also investigate the role that the Pt:Au ratio plays in determining the catalytic capability of Pt–Au NMA.
MATERIALS AND METHODS
Materials
An FTO glass sheet was cut into 1cm×1cm pieces for the SEM imaging and 1cm×6cm pieces for CV. They were then sterilized by subjecting them to sonication in an ultrasonic bath using distilled water and isopropyl alcohol. The chemicals used were EG, chloroplatinic acid hexahydrate (H2PtCl6.6H2O) and gold (III) chloride trihydrate (HAuCl4.3H2O) obtained from Sigma-Aldrich. The respective acid salts were then each dissolved in 90% ethanol to form 0.01M solution.
Deposition of Pt–Au NMA
NMA were deposited by reducing the metal precursors, H2PtCl6 and HAuCl4, with EG vapor. NMA of varying Pt:Au mass loading ratios were to be investigated. Hence, three 40ml solutions with different metal precursor mixing ratios were prepared. The mixing ratios were such that once they are reduced, they produce the required Pt:Au ratio (1:1, 1:2 and 1:3) on the glass substrates. A 40ml solution consisting of only H2PtCl6 without HAuCl4 was also prepared.
In a typical experiment, 10ml of the prepared solution was drop-casted onto the glass substrate. After drying the metal precursor layer at room temperature for 15 minutes, the substrate was placed into a large petri dish containing a small petri dish filled with EG. The large petri dish was then placed on a hot plate at 170°C for 15 minutes. The large petri dish was covered with a glass lid so as to create a closed environment, which allowed the vaporised EG to be contained within the dish and to effectively reduce the metal precursors. After 15 minutes, the glass cover was removed and the heating continued for another ten minutes in order to dry the substrate.
Characterization of Pt–Au NMA
To study the morphologies of NMA, SEM images of NMA were taken with a Zeiss Supra 40 field emission scanning electron microscope, with the extra high tension voltage fixed at 5kV under the secondary electron imaging mode. The XPS spectra of NMA, which are used to confirm if the metal precursors are successfully reduced to their metallic forms, were acquired using an Axis Ultra DLD X-ray photoelectron spectrometer equipped with an Al Ka1 X-ray source of 1486.6eV.
Electrochemical Catalysis of Pt–Au NMA
The CV was used to investigate the oxidation of CH3OH with the NMA-doped glass as the catalyst. The NMA glass substrate, a saturated calomel electrode and a Pt plate were used as the work, reference and counter electrode respectively. The electrolyte consisted of 0.5M H2SO4 and 0.5M CH3OH. The potential scan rate was 20mVs-1.
RESULTS
Pt–Au NMA Characterization Using SEM
Differing morphologies are observed under the SEM, for the three NMA of different Pt:Au mass loading ratios (Figure 1). For the 1:1–NMA, three-dimensional (3D) globular nanostructures were observed (Figure 1a). For the 1:2–NMA, 2D triangular and hexagonal nanoplates covered with mesh-like structures were observed (Figure 1b). For the 1:3–NMA, 3D nanocrystals were observed (Figure 1c).
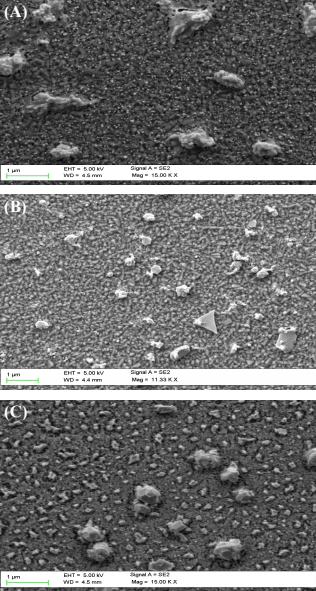
Figure 1. SEM images of Pt–Au NMA products in varying ratios. (a) 1:1 (b) 1:2 and (c) 1:3. SE2 represents the signal making up of secondary electrons generated from backscattered electrons. EHT (extra high tension) voltage; WD and Mag; working distance and magnification respectively.
Pt–Au NMA Characterization Using XPS
The three XPS spectra of the three NMA display four sets of peaks located around 71.0, 74.2, 83.7 and 87.5eV (Figure 2). The corresponding binding energies of the peaks will be compared with those of Pt and Au in existing literature to determine if the NMA are made up of metallic Pt and Au.

Figure 2. XPS spectra of NMA of various Pt:Au mass loading ratios. The spectra is plotted with the signal intensity in arbitrary units (A.U.) and binding energy in eV.
Electrochemical Catalytic Performance of Pt–Au NMA
From the oxidation of CH3OH on the Pt–Au NMA catalyst, the varying oxidation current shown in the cyclic voltammogram can determine the NMA’s catalytic performance. The 15th cyclic voltammograms of the NMA-FTO glass of different Pt:Au ratios, as well as the control FTO glass doped with only Pt, display two distinct current peaks (Figure 3). The right peak, If, which was produced by the forward sweep and the left peak, Ib, which was produced by the backward sweep when the potentials are ~ 0.7V and ~ 0.5V respectively. The If and Ib values for the Pt and various Pt–Au NMA catalysts are listed in Table 1.

Figure 3. 15th cyclic voltammogram of (a) control Pt and Pt–Au NMA products with ratios (b) 1:1, (c) 1:2 and (d) 1:3. The voltage is measured against the saturated calomel electrode (SCE). The positions of If and Ib peaks are indicated.
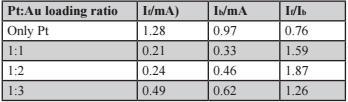
Table 1. If/Ib ratios for control Pt and NMA of various Pt:Au mass loading ratios.
DISCUSSION
Pt–Au NMA Characterization Using SEM
The differing morphologies exhibited by different NMA can be partially explained by existing literature and the specific surface energies of Pt and Au. Existing studies have shown that Au nanostructures are usually 2D (Cho, Mei, & Ouyang, 2012), while Pt nanostructures are 3D (Cho & Ouyang, 2011; Shen et al., 2008) when grown on substrates. By referring to their lowest surface energy crystallographic plane (111), given that Pt and Au have face-centered cubic structures, the specific surface energies of Pt and Au are 2.299 J m–2 and 1.283 J m–2 respectively (Vitos, Ruban, Skriver, & Kollar, 1998). The high surface energy of Pt causes Pt nanoparticles to cluster together, in order to minimize the surface area of Pt, for maximum stabilization, leading to the formation of 3D (rather than 2D) nanostructures. In contrast, the formation of 2D Au nanoplates (which have wide surface areas) is energetically feasible due to the low surface energy of Au. Thus, the highest concentration of Pt nanoparticles in the 1:1–NMA, compared to other NMA, can explain the observed overall 3D globular nanostructures dominated by Pt in the 1:1–NMA. Similarly, the more Au nanoparticles in the 1:2–NMA compared to the 1:1–NMA led to overall visible growths of 2D nanoplates dominated by Au in the 1:2–NMA but not in the 1:1–NMA.
However, no existing studies provide insight on the formation of 3D nanocrystals in the 1:3–NMA, which has more Au nanoparticles than that of 1:2–NMA. The transformation from 2D nanoplates to 3D nanocrystals may suggest that with increasing Au concentration, it is not energetic feasible for 2D nanoplates to exist. The higher total surface energy of Pt–Au system results in Pt and Au nanoparticles to cluster together to form crystalline structures for stabilization. Nevertheless, further research is necessary to explicate the transition from 2D nanoplates to 3D nanocrystals above the threshold Au concentration for Pt–Au NMA. Since the morphology controls the chemical reaction sites governing catalytic activity, understanding the morphological change can perhaps explain the different catalytic performances of Pt–Au NMA of varying ratios when used in fuel cells (Bing et al., 2010).
Pt–Au NMA Characterization Using XPS
As seen in the results section, for all three NMA, the binding energies associated with four sets of peaks are close to those reported in existing literature (Cho et al., 2012; Cho & Ouyang, 2011; Ye et al., 2011). These studies report that for metallic Pt and Au, the Pt4f bands lie around 71 and 74eV, and the Au4f bands lie around 84 and 88eV. Thus, from the spectra, the binding energies of the first two peaks (71.0 and 74.2eV) belong to Pt4f bands and the last two peaks (83.7 and 87.5eV) belong to Au4f bands. This indicates that the metal precursors were successfully reduced to their metallic forms in all NMA.
Electrochemical Catalytic Performance of Pt–Au NMA
From the voltammograms, the If peak was attributed to the three-step adsorption of CH3OH on Pt sites of NMA (Bagotzky, Vassilliey, & Khazova, 1977; Manoharan & Goodenough, 1992):
2Pt+CH3OH→Pt-CH2OH+Pt-H (1a)
2Pt+Pt-CH3OH→Pt2-CHOH+Pt-H (1b)
2Pt+Pt2-CHOH→Pt3-COH+Pt-H (1c)
The adsorbed H species will subsequently be lost into the solution as H+ ions, while liberating electrons that contribute to the If peak. In addition, OH species will be adsorbed throughout the three-step oxidation process, leading to the oxidation of adsorbed carbonaceous species in Equation 1 (CH2OH, CHOH and COH) to form CH2O, HCOOH and CO2 (Bagotzky, Vassilliey, & Khazova, 1977; Manoharan & Goodenough, 1992). Should the adsorbed carbonaceous species fail to be oxidised by OH species, at higher voltages, adsorbed COH species will be oxidised to CO and CO2, thereby liberating electrons that contribute to the If peak as well according to Equation (2a) (Manoharan & Goodenough, 1992):
Pt3+COH→Pt2-CO+Pt+H++e- (2a)
Pt2-CO+Pt-OH→Pt-CO2H+Pt (2b)
Pt-CO2H+Pt-OH→Pt-CO2+H2O (2c)
Some unreacted adsorbed CO can re-arrange to form double bonds with Pt sites in the NMA catalyst, causing catalytic poisoning (Manoharan & Goodenough, 1992). These double bonds can be destroyed by reversing the bias to remove adsorbed OH species and to free up Pt sites (Manoharan & Goodenough, 1992; Liu, Ling, Su, & Lee, 2004). During the backward sweep, the presence of CO motivates the conversion of adsorbed OH species into H2O, which liberates electrons that contribute to the Ib peak:
Pt-OH+H++e-→Pt+H2O (3)
With more free Pt sites, adsorbed CO doubly bonded to Pt will be converted back to Pt2−CO, and CO will be oxidised in later forward sweeps in Equations (2b) and (2c). The presence of peaks demonstrated the catalysts’ ability to oxidize CH3OH. Also, the number and positions of peaks indicated that chemisorption activities on NMA are attributed to Pt rather than Au, due to the poor OH species’ adsorption ability of Au (Xu, Zhao, Yeng, & Shen, 2010; Ye et al., 2011).
The catalyst’s performance can be determined by calculating the ratio of If/Ib. A lower ratio indicates a poorer catalytic performance. This is because a lower ratio corresponds to a higher Ib peak, which implies that more CO molecules are adsorbed to the catalyst and greater CO oxidation rate. The tabulated ratios in Table 1 show that the FTO glass doped with only Pt has the lowest ratio. Also, modifying the Pt:Au ratio would result in different tolerance performances, which the Pt:Au ratio of 1:2 yields the highest If/Ib ratio and best catalytic performance.
Comparing between Pt-doped catalyst with only Pt and Pt–Au NMA catalysts, Au plays a key role in enhancing the catalytic performance of Pt as described by Choi et al. (2006). It is because Au is responsible for increasing the oxidation rate of HCOOH by inducing a major oxidation reaction pathway, which reduces the formation of CO. Thus, lower amount of CO accumulates in Pt–Au catalysts, which reduce catalytic poisoning and lead to lower Ib peak in NMA compared to Pt-doped catalyst.
While the incorporation of small amount of Au leads to better catalytic performance, based on the current study that investigates three different Pt:Au ratios (1:1, 1:2 and 1:3), higher Au concentration above a threshold Pt:Au ratio of 1:2 can instead reduce the catalytic performance. According to Wang et al. (2010) and Ye et al. (2011), since the Fermi energies of Pt and Au are different, Au modifies the electronic structure of Pt–Au NMA, resulting in electrons tending to flow from Pt to Au. At high Au concentration, electrons are less available in Pt for adsorption of OH species that oxidize CO in Equations (2b) and (2c). In addition, as Pt (but not Au) is primarily responsible for the chemisorption activities, excessively high Au concentration in Pt–Au NMA implies that less Pt sites are available for adsorption of OH species. It is possible that less adsorbed OH species lead to more incomplete oxidation of CH3OH, more accumulation of CO and higher Ib peak. Hence, these explanations justify the peak catalytic performance at the Pt:Au ratio of 1:2.
In conclusion, this investigation had successfully deposited Pt–Au NMA on the FTO glass via the low heat, solvent-free polyol reduction. From SEM imaging, different Pt:Au loading ratios resulted in different morphologies, as attributed to differing total surface energies of Pt–Au systems. The XPS spectra confirmed that the precursors were reduced to metallic Pt and Au. Studying the electrochemical catalysis of methanol confirmed the hypothesis that the NMA-doped glass had a better catalytic performance than the Pt-doped glass. Also, another hypothesis that was verified is varying the Pt:Au ratio affects the catalytic performance, which its performance peaks at the Pt:Au ratio of 1:2. The investigated method provides a convenient alternative for producing high-performing catalysts compared to the high heat, solvent-based methods that are currently employed in industries. Future research can explain the changing morphologies of Pt–Au NMA with respect to varying Pt:Au ratio, which can assist other research seeking formulate new methods of controlling the morphology of Pt–Au NMA during the NMA production in order to develop optimally-performing NMA. Also, Pt–Au NMA of other Pt:Au ratios, apart from the three currently studied ratios (1:1, 1:2 and 1:3), can be characterized by other research to understand the catalytic performance change by increasing the Pt:Au ratio. This has important implications on situations where there is limited Pt or Au and there is a need to produce Pt–Au NMA of maximal catalytic capability with limited resources.
ACKNOWLEDGEMENTS
This project is conducted under the 2013 Undergraduate Research Opportunities Programme supported by the Faculty of Engineering at National University of Singapore. The author is grateful to his advisors, Dr. Karimbintharikkal G. Nishanthand Prof. Ouyang Jianyong for providing the necessary guidance for this project, as well as the Laboratory Office of Department of Materials Science and Engineering for providing the materials and equipment for this project.
REFERENCES
Bagotzky, V. S., Vassiliev, Y. B., & Khazova, O. A. (1977). Generalized scheme of chemisorption, electrooxidation and electroreduction of simple organic compounds on platinum group metals. Journal of Electroanalytical Chemistry and Interfacial Electrochemistry, 81(2), 229–238. doi: 10.1016/0368-1874(77)80299-2.
Bing, Y., Liu, H., Zhang, L., Ghosh, D., & Zhang, J. (2010). Nanostructured Pt-alloy electrocatalysts for PEM fuel cell oxygen reduction reaction. Chemical Society Reviews, 39(6), 2184–2202. doi: 10.1039/b912552c.
Cho, S. J., Mei, X., & Ouyang, J. (2012). Direct deposition of gold nanoplates and porous platinum on substrates through solvent-free chemical reduction of metal precursors with ethylene glycol vapor. Physical Chemistry Chemical Physics, 14(45), 15793–15801. doi: 10.1039/c2cp42164j.
Cho, S. J., & Ouyang, J. (2011). Attachment of platinum nanoparticles to substrates by coating and polyol reduction of a platinum precursor. The Journal of Physical Chemistry C, 115(17), 8519–8526. doi: 10.1021/jp2001699.
Choi, J. H., Park, K. W., Park, I. S., Kim, K., Lee, J. S., & Sung, Y. E. (2006). A Pt–Au nanoparticle electrocatalyst for methanol electro-oxidation in direct methanol fuel cells. Journal of the Electrochemical Society, 153(10), A1812–A1817. doi: 10.1149/1.2224055.
Ganesan, M., Freemantle, R. G., & Obare, S. O. (2007). Monodisperse thioether-stabilized palladium nanoparticles: synthesis, characterization, and reactivity. Chemistry of Materials, 19(14), 3464–3471. doi: 10.1021/cm062655q.
Gonsalvesa, K. E., Rangarajana, S. P., & Wang, J. (2000). Chemical synthesis of nanostructured metals, metal alloys, and semiconductors. Handbook of Nanostructured Materials and Nanotechnology, 1, 1–56. doi: 10.1016/b978-012513760-7/50004-6.
Herricks, T., Chen, J., & Xia, Y. (2004). Polyol synthesis of platinum nanoparticles: Control of morphology with sodium nitrate. Nano Letters, 4(12), 2367–2371. doi: 10.1021/nl048570a.
Jana, S., Dutta, B., Bera, R., & Koner, S. (2008). Immobilization of palladium in mesoporous silica matrix: preparation, characterization, and its catalytic efficacy in carbon–carbon coupling reactions. Inorganic Chemistry, 47(12), 5512–5520. doi: 10.1021/ic8004294.
Liu, Z., Ling, X. Y., Su, X., & Lee, J. Y. (2004). Carbon-supported Pt and PtRu nanoparticles as catalysts for a direct methanol fuel cell. The Journal of Physical Chemistry B, 108(24), 8234–8240. doi: 10.1021/jp049422b.
Mancharan, R., & Goodenough, J. B. (1992). Methanol oxidation in acid on ordered NiTi. Journal of Materials Chemistry, 2(8), 875–887. doi: 10.1039/jm9920200875.
Ren, H., Humbert, M. P., Menning, C. A., Chen, J. G., Shu, Y., Singh, U. G., & Cheng, W. C. (2010). Inhibition of coking and CO poisoning of Pt catalysts by the formation of Au/Pt bimetallic surfaces. Applied Catalysis A: General, 375(2), 303–309. doi: j.apcata.2010.01.018.
Shen, Q., Jiang, L., Zhang, H., Min, Q., Hou, W., & Zhu, J. J. (2008). Three-dimensional dendritic Pt nanostructures: sonoelectrochemical synthesis and electrochemical applications. The Journal of Physical Chemistry C, 112(42), 16385–16392. doi: 10.1021/jp8060043.
Skrabalak, S. E., Wiley, B. J., Kim, M., Formo, E. V., & Xia, Y. (2008). On the polyol synthesis of silver nanostructures: glycolaldehyde as a reducing agent. Nano Letters, 8(7), 2077–2081. doi: 10.1021/nl800910d.
Vitos, L., Ruban, A. V., Skriver, H. L., & Kollar, J. (1998). The surface energy of metals. Surface Science, 411(1), 186–202. doi: 10.1016/s0039-6028(98)00363-x.
Wang, C., Tian, W., Ding, Y., Ma, Y. Q., Wang, Z. L., Markovic, N. M., ... & Sun, S. (2010). Rational synthesis of heterostructured nanoparticles with morphology control. Journal of the American Chemical Society, 132(18), 6524–6529. doi: 10.1021/ja101305x.
Xu, J. B., Zhao, T. S., Yang, W. W., & Shen, S. Y. (2010). Effect of surface composition of Pt–Au alloy cathode catalyst on the performance of direct methanol fuel cells. International Journal of Hydrogen Energy, 35(16), 8699–8706. doi: 10.1016/j.ijhydene.2010.05.008.
Ye, W., Kou, H., Liu, Q., Yan, J., Zhou, F., & Wang, C. (2012). Electrochemical deposition of Au–Pt alloy particles with cauliflower-like microstructures for electrocatalytic methanol oxidation. International Journal of Hydrogen Energy, 37(5), 4088–4097. doi: 10.1016/j.ijhydene.2011.11.132.