
Author: Codey Collins
Institution: University of North Georgia
ABSTRACT
Prior research has found that progression in and successful completion of drug court programs is linked to mental health factors and various demographics. Little is known, however, about the characteristics and influences of these factors in relation to small rural drug courts, which often consist of a significantly smaller and more homogenous population of participants. This descriptive study examines demographics of a small rural drug court in the southeastern United States. The study included 39 participants (97.5% of the entire drug court) and utilized a mix of survey and archival data. A series of univariate and bivariate analyses were conducted to analyze the impact of mental health and substance abuse dynamics on participants’ progress in the program. The findings suggest that addiction severity is a key factor in determining the progress drug court participants make in these programs. Other factors such as income levels may be interactive with demographic and mental health characteristics. Implications and directions for future research are discussed.
INTRODUCTION
Drug court programs involve judicial management and handling of criminal offenses involving drugs, and in some cases, offenses that were deemed to be “caused” by a person’s addiction to drugs or alcohol. Over three decades ago, an existing drug epidemic of cocaine use turned into a crack epidemic and president Regan enacted a “war against drugs.” “Under the label of ‘war,’ arrests and incarceration for drug offenses increased, resulting in the inundation of the criminal justice system … [and] between 1980 and 1989, arrests for drug abuse violations increased 125 percent” (May, 2008). The war on drugs increased the number of prisoners in jail systems across the United States and, more precisely, created problems in the judicial system by placing the care and processing of drug related offenses in the caseloads of general, non-specialized criminal court systems that were already overburdened. In an effort to deal with the increase in arrests and subsequent drug related incarcerations, the Eleventh Judicial Circuit of Florida allowed implementation of an alternative method of case processing called drug court (Gallagher, 2014; Lurigio, 2008).
The drug court model provides intensive treatment and mental health services that require drug offenders to get and stay clean as well as become productive citizens (American University Drug Court Clearinghouse and Technical Assistance Project, 1999, 2012; Butzin, Saum, & Scarpitti, 2002; May, 2008; Portes & Landolt, 2000; Roll, Prendergast, Richardson, Burdon, & Ramirez, 2005; Urban Institute: Justice Policy Center, 2008; White, 2009). As of March 2012, a total of 2,231 drug courts comprising adult, family and juvenile programs operate in the United States, and 1,393 solely address adult cases. Each program is organized and operated according to its geographic location, the demographics of potential participants, funding characteristics, budget allocations, and staffing resources (American University Drug Court Clearinghouse and Technical Assistance Project, 2012).
Most research on drug courts has focused on large suburban or inner city programs with less research conducted on rural, small population jurisdictions. Studies by Deschenes, Ireland, and Kleinpeter (2009), Gallagher (2013), The National Center on Addiction and Substance Abuse (CASA) at Columbus University (2001) and Justice Policy Institute (2011) report varying drug court graduation rates (20% to 66%) and convey a need for greater understanding as to why some participants graduate while others do not. These studies stress demographic characteristics as well as program structure, delivery methods, and program settings as important factors in understanding participants’ progress in drug courts. Prior research has also found that successful completion of drug court programs is linked to mental health factors and various demographics. Gender has been identified as a particularly important factor in predicting successful outcomes. Various physiological, psychological, and social differences between males and females have clear implications for a participants’ program completion as well as what treatment and interventions should be used. Research suggests that males do better than females in treatment programs and attribute socially structural advantages that males may experience over females as one reason for the success gap (Hartman, Listwan, & Shaffer, 2007).
Research also suggests age is an important factor in determining who will benefit most from drug court programs, as age can influence the intensity of treatment needed to be effective (Marlowe, Festinger, Lee, Dugosh, & Benasutti, 2006; Mateyoke-Scrivner, Webster, Staton, & Leukefeld, 2004). Younger participants are not as apt as older participants to intently subscribe to treatment. Younger participants often have had less opportunity to reach “rock bottom” and have varying worldviews than their older counterparts. Additionally, significant generational gaps between participant and treatment facilitators may exist. Early drug use can affect addiction severity and lead to developmental obstacles that further impede participant progress.
Since the size of the eligible drug court population in rural areas (n = 36,250) is comparable to both suburban (n = 34,433) and urban (n= 39,239) settings and fewer eligible arrestees are treated in suburban (32.7%) and urban (48.4%) areas than in rural (69.3%) drug courts, there is a strong need for additional research exploring drug courts in rural settings (Urban Institute: Justice Policy Center, 2008). To address these gaps in the existing body of literature and add further texture to our understanding of small drug court dynamics, the present study examines how demographic and mental health characteristics impact participants’ progression through the drug court program.
MATERIALS & METHOD
The study was conducted in a small rural drug court program serving two counties in the southeastern United States. The program is based on a post-plea judicial structure, which includes therapeutic interventions provided by an independent private contract company. The program is intended to last 24 months and is broken into five phases, with Phase 1 set to last two months, Phase 2 for four months, and Phases 3-5 for six months each. However, nearly one-fourth of the participants had already been in the program for longer than 24 months when the study began (Table 1). Of the 40 participants in the drug court program, informed consent for participation in the study was obtained from 39 participants, yielding a 97.5% participation rate. Involvement in the study was completely voluntary with no obligation or legal recourse for participation or non-participation.

Table 1. Phase Dynamics and Program Length of Drug Court Participants. Phase Status denotes which phase of the program each participant was in at the time of data collection. Length of Time in Program denotes the length of time between participants’ entry date into Phase 1 of the program up to the time of data collection and adjusted for variance of calendar days. Sample size varies (n = 34 to 39) as some participants had been “phased down” and were required to restart their phase work, yet were allowed to remain in the program.
To evaluate participants’ progression through the program, archival data collection was conducted on site at the private treatment center. Program intake data was obtained, which yielded information on participants’ alcohol (Selzer, 1971) and drug addiction (Skinner, 1982) status at the time of intake as well as addiction history, including participants’ age of first drug and alcohol use. Meeting notes documented between 2009 and 2012 were also collected to create a measure of program progress and capture other mental health and lifestyle related factors such as drug use, network dynamics, and hobbies. To obtain additional demographic characteristics not available in the archival data, creation of a questionnaire was necessary. Finally, survey data was then collected via the created questionnaires.
The Michigan Alcohol Screening Test (MAST) (Selzer, 1971) and the Drug Abuse Screening Test (DAST-20) (Skinner, 1982) were employed to evaluate participants’ drug and alcohol addiction severity levels at the time of entry into the drug court program. Participants’ progress was determined by measuring the amount of time between each participant’s date of entrance into the program and graduation, termination, or phase completion. Creation of a progress variable consisted of using a participant’s phase status at the time of data collection, their entrance date into each phase, and the length of time they spent in each phase (Table 1). The amount of time spent in the program was compared to the expected length of each phase. Assignment to fast, average, or slow for each participant occurred in each phase. The overall assignment of a participant’s progress status was based on an average from all phases he or she had been in.
A measure of socioeconomic status was created by adapting Thompson and Hickey’s (2005) model of social class into baseline measurement of participants income levels. Participants that scored 0-1 on education and 1-2 on income were assigned to lower class. Working class designation arose from an education score of 1-2 with an income score of 2. Lower middle class assignment was obtained with an education score of 2-3 plus an income score of 3-4. Occupation facilitated the placement into one category over another during instances of overlapping score ranges. For instance, some participants with a lower education level earned more money than some participants with a higher educational level, known in academia as status incongruity. Thus, the addition of the third variable, occupation, provided a more holistic picture of social class and adjusted for “tied” scores.
Quantitative data were analyzed using SPSS (Version 20.0; IBM Corp., 2011). General demographic data were compiled in SPSS. In addition, a series of univariate and bivariate analyses (e.g. chi-square tests, Mann-Whitney U tests, and Student’s t-tests) were conducted.
RESULTS
Demographics Snapshot
This study included 39 participants evenly distributed by gender (Table 2). Seventy-one percent of participants were 34 years of age or younger. The average age of participants was 30.8 years (SD = 9.92). Males (M = 26.28 years; SD = 5.9) were on average younger than female participants (M = 34.8 years; SD = 11.11). Participants used an average of four drugs (SD = 2.37). Four participants used only stimulant drugs (11.8%), five used only depressants (14.7%), and the remaining 25 participants used a combination of stimulants and depressants (73.5%).
The average income of the participants was $20,082 (SD = 15,228), and 81.3% earned incomes lower than $29,999. About 15.6% of the participants have held no degree, 65.6% held a high school diploma or GED, and 15.6% hold a college degree. The mean DAST-20 and MAST scores were 10.37 (SD = 3.65) and 4.41 (SD = 3.72), respectively. Of the participants who reported using recreational drugs, 40.0% claimed their first use occurred between the ages of 9 and 14 (n = 16). Similarly, 42.5% stated their first use of alcohol occurred between the ages of 9 and 14 (n = 17) (Figure 1). Participants spent an average of 19.9 months (SD = 5.56) in the program (Table 1).
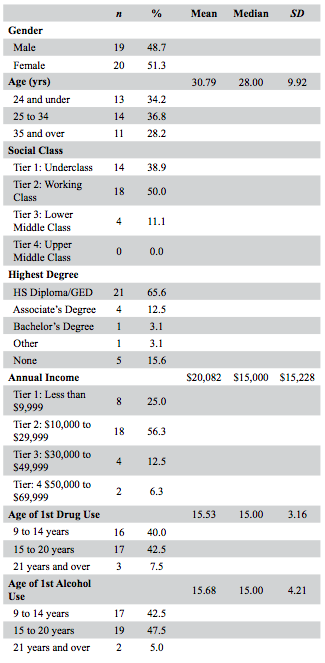
Table 2. General Demographics of Drug Court Participants. The variables in this table were used as predictor variables during data analysis. The social class variable is loosely based on Thompson & Hickey’s (2005) model of social class. Sample size varies (n = 27 to 39) as some participants omitted reporting data in some categories.

Figure 1. Age ranges of initial drug use (n = 36) and alcohol use (n = 38). When initial use of drugs and/or alcohol occurred at the age of 21 or older, more participants tried drugs than alcohol. When initial use occurred between the ages of 9 and 20 years old, more participants tried alcohol for the first time than drugs.
Progress Dynamics
A statistically significant correlation was found between participants’ rate of progression through the program and initial level of drug addiction severity as measured by the DAST-20. Participants progressing through the program at a slow rate had higher DAST-20 scores than participants progressing at an average rate (t(29) = 2.235, p = .033, d = .797) (Figure 3 A). A similar correlation was observed with MAST scores, though it was not statistically significant (t(28) = -1.743, p = .092, d = -.658) (Figure 3 B).
The effects of social class on substance use severity are more ambiguous. No significant difference was observed in DAST-20 scores between lower and working class participants (U = 90.5, p = .797). A nearly significant difference was observed between participants in the third and fourth income tiers, (t(19) = 1.546, p = .063). Likewise, lower and working class participants did not have statistically different alcohol addiction scores (U = 13.00, p = .495). However, differences with regard to alcohol dependency between participants in the first and third income tiers approached significance (t(22) = -1.748, p = .095). Similarly, differences between participants in the second income tier and a combined third and fourth income tier were almost statistically significant (t(19) = 2.117, p = .059).
We did not observe age effects on addiction severity. Neither the age nor the unique substance use histories of program participants appeared to influence addiction severity at the time of program intake. For example, no significant correlation was found between age of first drug use and DAST-20 score. DAST-20 scores of participants aged 9 to 14 at first use were not significantly different from those aged 15 to 20 at first use (t(27) = 1.316) , p = .202, d = .506) (Figure 2 A). Similar results were observed with MAST scores between these two groups (t(26) = .384, p = .704, d = .150) (Figure 2 B).
No statistically significant relationship was observed between participants’ age of first drug use and progress through the program, (χ2 = 4.90, p = .297). Moreover, the chi-square test showed no significant relationship between participants’ age of first alcohol use and progress (χ2 = .456, p = .978). Also, a chi-square test showed no statistically significant relationship between social class and rate of progression through the program (χ2 = 3.46, p = .483).

Figure 2. Average scores of participants’ drug and alcohol abuse severity scores.
(A) DAST-20 and (B) MAST are compared based on the age of first use. Participants’ average drug abuse severity scores are higher than their alcohol abuse severity scores, suggesting that they are more severely addicted to drugs than alcohol.

Figure 3. Average scores of participants’ drug and alcohol abuse severity score.
(A) DAST-20 and (B) MAST are represented by their respective slow or average progress. Participants with slow program progress had higher average drug abuse severity scores (A). However, participants progressing at an average rate in the program showed a higher average alcohol abuse severity score (B).
DISCUSSION
The Bigger Picture: Demographic Sketches of the Drug Court
The findings suggest that addiction severity is a key factor in understanding the progress that drug court participants make in these programs. Other factors such as income levels may be interactive with demographic and mental health characteristics but the patterns are not as clear. Several demographic characteristics of this study’s sample group are unique among drug court participants: gender composition, mean income, educational levels, and substance use histories. While most participants in drug court studies conducted in the late 1990s and early 2000s were male (Tauber, 1995; Vito, 1998; Wolfe, Guydish, & Termont, 2002), approximately half the participants in the present study are female. On a national level, twice as many men (73%) participated in these programs as did women (27%) in 2001 (American University Drug Court Clearinghouse and Technical Assistance Project, 1998, 2001; The National Center on Addiction and Substance Abuse (CASA) at Columbia University, 2001) and have much higher recidivism rates than females (American University Drug Court Clearinghouse and Technical Assistance Project, 2001; Spohn, Piper, Martin, & Frenzel, 2001; United States General Accounting Office, 1997; Wolfe, Guydish, & Termont, 2002). Therefore, this program may be predisposed to more successful treatment outcomes for a number of factors, especially gender difference and the tendency for women to have lower recidivism rates than males. Furthermore, compared to other drug courts, in which mean incomes range from $7,040 (National Drug Court Institute, 2012) to $11,659 (Urban Institute: Justice Policy Center, 2011a), this adult drug court also serves a wealthier population (M = $20,082).
Participants in this study were also better educated than the average drug court participant, having nearly twice the percentage (65.6%) of participants who finished high school or earned a GED as those in other prevalent studies of drug courts (35%) (National Drug Court Institute, 2012; Urban Institute: Justice Policy Center, 2011b). This may have also increased the study participants’ success in the program.
Finally, the participants in this rural drug court began their substance use careers slightly later than the national average of 13.6 years of age (National Drug Court Institute, 2012). In contrast, 30.1% of participants in other drug courts (compared to 42.5% in the current sample) had tried alcohol before the age of 15 (Shaffer, Hartman, Listwan, Howell, & Latessa, 2011). These demographic and drug use history factors may be important for better understanding progress trajectories of participants in rural based settings, such as the current study.
Role of Addiction Severity Dynamics
Participant progression through drug court programs is constantly measured and monitored by program administrators, judicial stakeholders, and researchers alike. However, since there are various stakeholders within drug court programs – ranging from community to state and federal levels – and with program participants often crossing geo-political jurisdictions, uniformity in data collection, analysis, and reporting can be problematic (Heck, Roussell, & Culhane, 2009; Substance Abuse and Mental Health Services Administration (US), 1996). Although progress data for participants in this study came primarily from program archives, the construction of the progress variable allowed for greater internal consistency of data analysis. “Most of the evaluations of drug court programs that have taken place up to this point have involved archival review of participant charts, so you work with what you have,” (Festinger, 2009).
Existing literature examines a combination of capitals – emotional, physical, cultural, and normative – and their respective resources that participants in drug court programs possess and or can access through networking (Woodall & Boeri, 2013; Zschau, Collins, Lee, & Hatch, 2015). Literature on drug abuse recovery often refers to a social class variable (SCV). A typical SCV incorporates an individuals’ income, education, and occupation, among which income is generally considered to be the most important factor (Thompson & Hickey, 2005). In the present study, the SCV attempts to account for differing addiction severity levels and progress within the program. However, the SCV concerning education and occupation, as opposed to only income, had no discernable impact on participants’ progress. While participants’ overall income levels were not related to progress dynamics, participants with higher incomes progressed slightly more slowly while having lower addiction severity levels. In contrast, those with lower incomes progressed slightly faster but suffered from higher addiction severity levels at intake. These results show that having a higher income does not necessarily presuppose a fast program progression.
One possible explanation for these findings may be the emphasis that drug court treatment providers and administrators place on internalizing and adhering to the twelve-step philosophy. Judges and counselors may simply hand out more sanctions for non-compliant participants. Middle-class individuals are likely to be more comfortable questioning authority, which may partly explain why individuals with higher incomes progress more slowly through drug court programs (Lareau, 2003; Payne, 1996).
Our findings also suggest substance use severity may have an important impact on progress. Participants with severe substance abuse histories, especially regarding recreational drugs, are less likely to graduate a recovery program, are more likely to recidivate, and tend to make slower progress while in drug court programs (Center for Court Innovation, 2013). Consistent with this research, participants in the present study that had higher drug addiction scores at intake progressed more slowly than those with lower scores. In contrast, higher levels of alcohol addiction at the onset of the program and/or having prior alcohol histories did not affect progress in the program the same way drugs did. One possible explanation for these findings may come from previous research on social network dynamics in drug-using subpopulations. Unlike alcohol abuse, which involves the consumption of a legal substance, recreational drug use centers on network dynamics that put strong normative pressures on individuals to obtain, share, and distribute illegal drugs. Thus participants heavily involved in illegal-drug subcultures are likely to struggle more with successfully completing drug court programs (Boeri, Lamonica, & Harbry, 2011; Portes, 1998; Zschau, Collins, Lee, & Hatch, 2015). Other factors that shape addiction severity may be important for understanding progress dynamics within a recovery program.
Factors Impacting Addiction Severity
Two variables evaluated in this study, age of first substance use and income, may have an important impact on addiction severity. Existing research on alcohol abuse suggests that early use is often associated with higher levels of abuse later in life. For example, a recent study of over 43,000 adults indicates that those who reported drinking before the age of 14 were more likely to suffer from alcohol dependence later in life (Griffin, Bang, & Botvin, 2010; Hingson, Heeren, & Winter, 2006). In the current study, participants who started abusing alcohol before the age of 21 had significantly higher MAST scores than other participants. Furthermore, 23.5% of participants scored in the highest addiction severity range on the MAST, as opposed to only 8.6% of participants scoring in the highest addiction severity range on the DAST-20 (Table 3). This seems to suggest that drug use histories and age of first use of substances are important in understanding addiction severity.

Table 3. Indicators of Addiction Severity and Progress of Drug Court Participants. DAST and MAST scores are based on specific score interpretation guidelines (Skinner, 1982; Selzer, 1971). Participant progress was coded as Slow = 1, Average = 2, and Fast = 3. Sample size varies (n = 33 to 39) as data for some participants’ scores were not available.
Another important factor in understanding drug addiction severity is income. In this study, participants in the lower income bracket had on average higher DAST-20 scores. As Leukefeld, Webster, Staton-Tindall, and Duvall (2007) argue, greater drug addiction severity increases the likelihood of other problems in life arising. This may explain why participants with higher income levels have lower drug addiction scores. More affluent participants may have access to resources that lessen their chances of entering an addictive spiral, and financial resources may reduce the impact of other stressors. In short, income seems to be an important factor when assessing addiction severity and its relation to a participants’ program progression.
CONCLUSION
This study provides important insights for understanding participant progress in rural drug court programs. Our research stresses that both drug use history and position within the societal stratification system can influence a participant’s progression within a recovery program. For program administrators, developing more nuanced treatment protocols focusing specifically on drug abuse and drug history may lead to more fruitful and positive outcomes. Future research should seek to better understand how drug courts can facilitate higher levels of program progress, especially in rural settings. Specifically, future explorations of drug court programs should evaluate the roles of social class, income, and type of drug use in participant progression and ultimate success within drug court programs.
ACKNOWLEDGEMENTS
The authors express thanks to the stakeholders of the drug court program, including participants, rehabilitation administrators, and judicial administrators. Gratitude is also extended to Stephanie Gentry (School of Social Work, University of Georgia) and Keemia Vaghef (Human Resource Management, Department of Extended Studies, Florida Institute of Technology) for their work during early stages of participant data collection and analysis. Likewise, the authors thank the anonymous reviewers along with the editors for their constructive comments on earlier drafts of this manuscript. This research was supported by a generous Center for Undergraduate Research and Creative Activities grant from the University of North Georgia.
REFERENCES
American University Drug Court Clearinghouse and Technical Assistance Project. (1998). Looking at a decade of Drug Courts (Department of Justice, Trans.). Washington, D.C.: Drug Courts Program Office.
American University Drug Court Clearinghouse and Technical Assistance Project. (1999). Looking at a decade of Drug Courts (Department of Justice, Trans.) (pp. 4). Washington, D.C.: Drug Courts Program Office.
American University Drug Court Clearinghouse and Technical Assistance Project. (2001). Drug Court activity update: (Department of Justice, Trans.) Summary information on all programs and detailed information on adult drug courts. Washington, D.C.: Drug Courts Program Office.
American University Drug Court Clearinghouse and Technical Assistance Project. (2012). Drug Court activity update: March 1st, 2012 (Department of Justice, Trans.). Washington, D.C.: Drug Courts Program Office.
Boeri, M., Lamonica, A., & Harbry, L. (2011). Social recovery, social capital, and drug courts. Practicing Anthropology 31(1), 8-13.
Butzin, C. A., Saum, C. A., & Scarpitti, F. R. (2002). Factors associated with completion of a drug treatment court diversion program. Substance use & misuse, 37(12-13), 1615.
Center for Court Innovation. (2013). A statewide evaluation of New York's adult drug courts: Identyfing which policies work best New York: Urban Institute: Justice Policy Center
Deschenes, E. P., Ireland, C., & Kleinpeter, C. B. (2009). Enhancing drug court success. Journal of Offender Rehabilitation, 48(1), 19-36.
Festinger, D. (2009) Treatment institute seeks to help drug courts with tracking progress. Alcoholism & Drug Abuse Weekly (Vol 25), John Wiley & Sons, Inc.
Gallagher, J. R. (2013). Drug court graduation rates: Implications for policy advocacy and future research. Alcoholism Treatment Quarterly, 31(2), 241-253.
Gallagher, J. R. (2014). Predicting criminal recidivism following drug court: Implications for drug court practice and policy advocacy. Journal of Addictions & Offender Counseling, 35(1), 15-29.
Griffin, K. W., Bang, H., & Botvin, G. J. (2010). Age of alcohol and marijuana use onset predicts weekly substance use and related psychosocial problems during young adulthood. Journal of Substance Use, 15(3), 174-183.
Hartman, J. L., Listwan, S. J., & Shaffer, D. K. (2007). Methamphetamine users in a community-based drug court: Does gender matter? Journal of Offender Rehabilitation, 45(3/4), 109-130.
Heck, C., Roussell, A., & Culhane, S. E. (2009). Assessing the effects of the drug court intervention on offender criminal trajectories. Criminal Justice Policy Review, 20(2), 236-246.
Hingson, R. W., Heeren, T., & Winter, M. R. (2006). Age at drinking onset and alcohol dependence: Age at onset, duration, and severity. Arch Pediatr Adolesc Med, 160(7), 739-746.
Justice Policy Institute. (2011). Addicted to courts: How a growing dependence on drug courts impacts people and communities. Washington, DC: Author.
Lareau, A. (2003). Unequal childhoods: Class, race, and family life (1st ed.): University of California Press.
Leukefeld, C., Webster, J. M., Staton-Tindall, M., & Duvall, J. (2007). Employment and work among drug court clients: 12-Month outcomes. Substance use & misuse, 42(7), 1109-1126.
Lurigio, A. J. (2008). The first 20 Years of drug treatment courts: A brief description of their history and impact. Federal Probation, 72(1), 13-17.
Marlowe, D. B., Festinger, D. S., Lee, P. A., Dugosh, K. L., & Benasutti, K. M. (2006). Matching judicial supervision to clients' risk status in drug court. Crime and delinquency, 52(1), 52-76.
Mateyoke-Scrivner, A., Webster, J. M., Staton, M., & Leukefeld, C. (2004). Treatment retention predictors of drug court participants in a rural state. American Journal of Drug & Alcohol Abuse, 30(3), 605-625.
May, C. K. (2008). Drug courts: A social capital perspective. Sociological Inquiry, 78(4), 513-535.
National Drug Court Institute. (2012). Best practices in drug courts. The Drug Court Review, 8(1).
Payne, R. (1996). A framework for understanding poverty Highlands, TX: aha! Process, Inc.
Portes, A. (1998). Social capital: Its origins and applications in modern sociology. Annual Review of Sociology, 24(1), 1.
Portes, A., & Landolt, P. (2000). Social capital: Promise and pitfalls of its role in development. Journal of Latin American Studies, 32(2), 529.
Roll, J., Prendergast, M., Richardson, K., Burdon, W., & Ramirez, A. (2005). Identifying predictors of treatment outcome in a drug court program. American Journal of Drug & Alcohol Abuse, 31(4), 641-656.
Selzer, M. L. (1971). Michigan alcoholism screening test: Melvin Selzer, M.D., 6967 Paseo Laredo, La Jolla, CA 92037; Telephone: 619-459-1035.
Shaffer, D. K., Hartman, J. L., Listwan, S. J., Howell, T., & Latessa, E. J. (2011). Outcomes among drug court participants: Does drug of choice matter? International Journal of Offender Therapy and Comparative Criminology.
Skinner, H. A. (1982). Drug abuse screening test. 33 Russell Street, Toronto, Ontario M5S 2S1, Canada: Centre for Addiction and Mental Health, Marketing Services, Telephone: 416-595-6059.
Spohn, C., Piper, R. K., Martin, T. J., & Frenzel, E. D. (2001). Drug courts and recidivism: The results of an evaluation using two comparison groups and multiple indicators of recidivism. Journal of Drug Issues, 31(1), 149-176.
Substance Abuse and Mental Health Services Administration (US). (1996). Program Planning Treatment drug courts: Integrating substance abuse treatment with legal case processing. Rockville (MD).
Tauber, J. (1995). An evaluation of the Oakland drug court after three years.: Oakland-Piedmont-Emeryville Municipal Court and Alameda County Probation Department.
The National Center on Addiction and Substance Abuse (CASA) at Columbia University. (2001). Research on drug courts: A critical review. New York: n.a.
Thompson, W., & Hickey, J. (2005). Society in focus. Boston, MA:: Allyn & Bacon.
United States General Accounting Office. (1997). Drug courts: Overview of growth, characteristics, and results. (GAO/GGD-97-10). Washington, D.C.: Author.
Urban Institute: Justice Policy Center. (2008). To treat or not to treat: Evidence on the prospects of expanding treatment to drug-involved offenders. Washington, D.C.: Author.
Urban Institute: Justice Policy Center. (2011a). The Multi-site Adult Drug Court Evaluation: Study Overview and Design (Vol. 1). Washington, DC: Author.
Urban Institute: Justice Policy Center. (2011b). The Multi-site adult drug court evaluation: What's happening with drug courts? A Portrait of adult drug courts in 2004 (Vol. 2). Washington, DC: Author.
Vito, G., &Tewksbury, R. (1998). The impact of treatment: The Jefferson County (Kentucky) drug court program. Federal Probation, 62(2), 1-46.
White, W. (2009). The mobilization of community resources to support long-term addiction recovery. Journal of Substance Abuse Treatment, 36(2), 146-158.
Wolfe, E., Guydish, J., & Termont, J. (2002). A drug court outcome evaluation comparing arrests in a two year follow-up period. Journal of Drug Issues, 22, 1155-1172.
Woodall, D., & Boeri, M. (2013). “When you got friends in low places, you stay low”: Social networks and access to resources for female methamphetamine users in low-income suburban communities. Journal of Drug Issues.
Zschau, T., Collins, C.J., Lee, H., & Hatch, D. L. (2015). The hidden challenge: Limited recovery capital of drug court participants' support networks. Journal for Applied Social Science, 1-22.