
Author: Anthony J. Eckdahl and Todd J. Eckdahl
Institution: [1] Saint Joseph Central High School, 2602 Edmond St., Saint Joseph, MO 64501; [2] Department of Biology, Missouri Western State University, 4525 Downs Drive, Saint Joseph, MO 64507
doi:10.22186/jyi.31.3.1-8
ABSTRACT
Gene expression in bacteria begins with transcription, the process by which the base sequence of DNA is copied into RNA. Promoters contain the DNA structural and chemical information for the initiation of transcription by RNA polymerase. Many bacterial promoters have conserved DNA sequences for this purpose called the -35 region and the -10 region. We used a new system for promoter research called pClone Red to carry out mutational analysis of the -35 region of a high strength promoter. We constructed a library of 4,096 mutant promoters by varying the six bases in the -35 region of the Ptac promoter. We isolated and sequenced 81 functional promoters from the library, and measured the strength of transcription initiation for each of them using a red fluorescent protein reporter gene. We developed a weighted consensus method to determine a pClone -35 consensus sequence formula for the 81 promoters. Consensus sequence variants functioned with a strength similar to that of the published natural consensus for the -35 region and functioned in two other promoters with different sequence contexts. Our results contribute to a basic research understanding of transcriptional initiation in bacteria, and our set of 81 promoters with varying strengths provide new tools for applied research in synthetic biology and biotechnology.
INTRODUCTION
Gene expression is the process by which gene information is used to direct the function of cells. It is regulated in all cells because not all genes are required all the time or under all circumstances. For example, human brain cells need to express certain genes that are not needed in muscle cells, and vice versa (Gurdon & Melton, 2008). In a similar sense, bacteria must express different genes depending on temperature, pH, osmotic pressure, or the availability of food (Beales, 2004). Knowledge of gene regulation is important for understanding the differentiation and function of eukaryotic cells, the development of tissues in multicellular organisms, and the relationships of bacteria to their environments throughout the biosphere. It helps us to understand genetic diseases, diseases impacted by genetics, and cellular disorders such as cancer (López-Bigas & Ouzounis, 2004). Gene regulation research can also be used to explore the contribution of bacterial microbiomes to human health and disease (Cho & Blaser, 2012). In the context of synthetic biology, research results on the regulation of gene expression are being applied to engineer bacterial cells that produce pharmaceuticals, attack cancer cells, neutralize environmental pollutants, and synthesize biofuels (Khalil & Collins, 2010).
Gene expression begins with transcription, the process by which DNA information, in the form of the base sequence of a gene, is converted into RNA base sequence information. For genes that encode proteins, the RNA product of transcription is used during translation to encode the sequence of amino acids in a protein. As the first step in gene expression, transcription is an important control point for gene regulation. Initiation of transcription in bacteria involves binding of an enzyme called RNA polymerase to a sequence of DNA called a transcriptional promoter. As illustrated in Figure 1, a common form of bacterial promoters includes two conserved sequence elements, a -35 region that is recognized during transcriptional initiation by RNA polymerase and its associated Sigma factor, and a -10 region that is involved in DNA melting (Ross, Aiyar, Salomon, & Gourse, 1998). The consensus sequence for the -35 region of E. coli promoters has been widely reported to be TTGACA (Harley & Reynolds, 1987; Lisser & Margalit, 1993). The consensus sequence of the -10 region is TATAAT (Waterman, Arratia, & Galas, 1984). The RNA polymerase attaches itself to one of the two DNA strands referred to as the template strand and begins to use it to make RNA. The RNA polymerase proceeds to slide along the template strand for the entire length of the gene, reading it in a 3’ to 5’ direction. Transcription ceases when the RNA polymerase encounters a transcriptional terminator. In bacteria, the resulting RNA transcript is used for translation as soon as it is available.
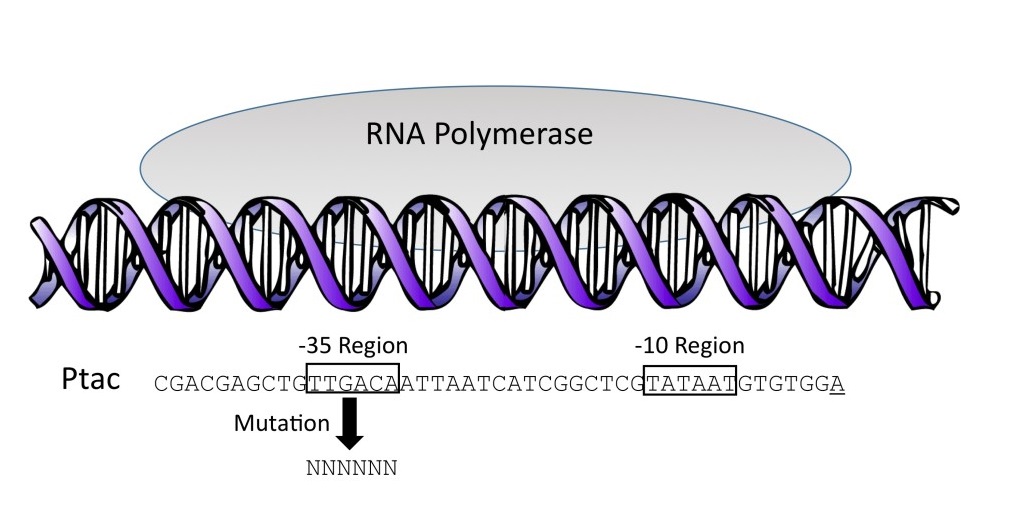
Figure 1. Initiation of bacterial transcription. The promoter shown is Ptac. The arrow indicates mutation of each of the six bases (shown as Ns) in the Ptac -35 region, producing a library of 4,096 sequence variants.
Mutational analysis of the -35 region of naturally occurring promoters showed that the -35 region is involved in the initial binding of the RNA polymerase to the promoter, and that it is an important contributor to the overall strength of a bacterial promoter. An in vitro study of the effect of mutations in the -35 region on the binding affinity of RNA polymerase and the rate of open promoter complex formation demonstrated that the consensus sequence of TTGACA exhibited the highest values for both parameters (Kobayashi, Ishihara & Nagata, 1990). An in vivo mutational analysis revealed that the strength of a promoter was halved by deletions that replace the -35 region with unrelated sequences (Bingham, Busby, Ponnambalam & Webster, 1986).
We chose to investigate the effect of mutations in the -35 region by 1) building a library of all 4,096 variants of the six base -35 region, 2) randomly selecting promoters from the library, 3) measuring the strengths of the promoters, 4) determining the DNA sequence of the promoters, and 5) compiling a -35 region consensus sequence from the promoters. For our study, we chose the Ptac bacterial promoter, which is a high-strength hybrid promoter derived from the Ptrp and Plac promoters (DeBoer, 1983; Figure 1). The high-strength property allowed a wide range of lower efficiencies to be generated. The sequence of the Ptac promoter is shown in Figure 1. The sequence of the -35 region is identical to the -35 region consensus of TTGACA. The method by which we introduced mutations into Ptac involves a system recently developed by our research group (Campbell et al., 2014). Figure 2 illustrates the structure of our pClone Red plasmid for cloning and measuring bacterial promoters. The pClone Red plasmid has a backwards facing promoter that causes expression of Green Fluorescent Protein (GFP). A new promoter is cloned into pClone Red by Golden Gate Assembly, a new cloning method that employs DNA ligase and type IIs restriction endonucleases such as BsaI to conduct restriction digestion and ligation at the same time for seamless connection of DNA parts (Engler, Gruetzner, Marillonnet, Weber, & Werner, 2011). A new promoter cloned into pClone Red faces forward and expresses Red Fluorescent Protein (RFP). The amount of RFP expressed depends on the strength of the new promoter.
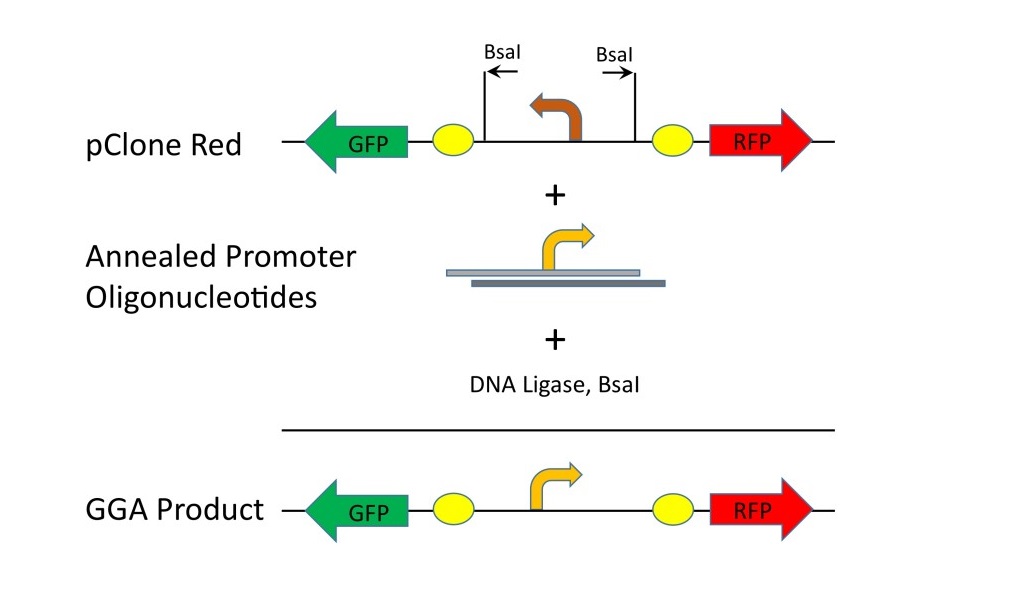
Figure 2. Cloning mutant promoters with pClone Red. Mutant promoters in the form ofannealed promoter oligonucleotides can be cloned into pClone Red with Golden Gate Assembly (GGA) using BsaI and DNA ligase.In the resulting GGA products, the strength of the mutant promoters canbe measured by RFP production.
We used pClone Red to produce a library of mutant promoters by varying each of the six bases of the -35 region of the Ptac promoter. We collected 81 different clones with varying intensities of the RFP reporter to quantify the strength of transcription initiation for each one. Our results add to the understanding of transcriptional initiation in bacteria. They suggest that promoter sequence variation in the -35 region affects sigma factor binding. Our consensus sequence is an alternative testable hypothesis about the expected strengths of bacterial promoters. The 81 promoter variants have various strengths that can be used to build complicated genetic circuits that require specific ratios of gene expression. These genetic circuits have many applications in energy, medicine, bioremediation, or biotechnology.
MATERIALS & METHODS
We introduced mutations into the Ptac -35 region by designing DNA oligonucleotides (Integrated DNA Technologies, Inc., Coralville, Iowa). We used six Ns in the place of the TTGACA sequence that comprises the -35 region of the Ptac promoter. The sequence of the top strand oligonucleotide was
(5’-CGACGAGCTGNNNNNNATTAATCATCGGCTCGTATAATGTGTGGA-3’)
and the sequence of the bottom strand oligonucleotide was
(5’-CCGCTCCACACATTATACGAGCCGATGATTAATNNNNNNCAGCTC-3’).
For use in Golden Gate Assembly (GGA), the top strand oligonucleotide starts with a 5’ CGAC sticky-end and the bottom strand begins with a 5’ CCGC sticky-end. Prior to GGA, we annealed the top and bottom strand oligonucleotides at 5µM in the annealing reaction. We prepared a 20µL annealing reaction using 16µL of H2O, 2µL of 10X annealing buffer (1M NaCl, 100mM Tris-HCl pH 7.4), 1µL top strand promoter oligonucleotide, and 1µL bottom strand promoter oligonucleotide. We boiled the annealing reaction in 400mL of water for 4min and allowed it to cool slowly overnight in the same water bath.
The annealed oligonucleotides were diluted with water to the same concentration as the pClone Red destination vector (Campbell et al., 2014; http://parts.igem.org/Part:BBa_J119137 in the Registry of Standard Biological Parts) to provide a 1:1 molar ratio of promoter insert to pClone vector in the GGA reaction. For GGA, we use a vector concentration of 40nM (60ng/µL of pClone Red) and diluted the annealed and cooled oligonucleotides to 40nM. We diluted the 100µM oligonucleotides to 5µM (5000nM) in the annealing reaction and further diluted the annealed oligos 125-fold (5000nM/40nM) by adding 124µL of H2O to 1µL of the cooled oligonucleotides. We performed GGA reactions in a total volume of 10µL containing 6µL H2O, 1µL 10X T4 DNA Ligase Buffer (supplied by New England BioLabs, Ipswich, Massachusetts as 300mM Tris-HCl pH 7.8 at 25°C, 100mM MgCl2, 100mM DTT and 10mM ATP), 1µL of 40 nM pClone Red destination vector, 1µL of 40nM annealed promoter oligonucleotides, 0.5 µL HF (high fidelity; New England BioLabs, Ipswich, Massachusetts) BsaI (10 units), and 0.5µL T4 DNA Ligase (New England BioLabs, Ipswich, Massachusetts; 50 Weiss units). We placed the GGA reactions in a thermal cycler set for 20 cycles of 1min at 37°C followed by 1min at 16°C. The 37°C temperature favors digestion by BsaI-HF while the 16°C favors ligation by T4 DNA ligase. The GGA reactions ended with a 15min incubation at 37°C to cleave the remaining BsaI sites. We transformed the completed GGA reactions into Z-competent E. coli JM109 cells (Zymo Research, Irvine, California) by adding competent cells to the completed GGA reaction, placing the mixture on ice for 5min, and pipetting it directly onto a LB agar plate with 50µg/mL ampicillin. We incubated the plates overnight at 37°C.
Library Exploration
We photographed pClone mutant promoter library plates to document the colors of the colonies and chose those that had a wide range of RFP expression due to different promoter strengths. We transferred 81 colonies to LB + ampicillin liquid media with a sterile toothpick for overnight growth. We made a glycerol stock for each of them using 300µL sterile glycerol and 700µL of overnight bacterial culture. We determined the strength of the promoters by quantifying the RFP output of clones with a fluorometer (Bioteck, Winooski, Vermont) set for 585nm excitation and 615nm emission. We measured cell density with absorbance at 600nm and expressed RFP fluorescence as a ratio with cell density values in the denominator. We isolated plasmid DNA from 8mL cultures of each clone grown overnight in LB with ampicillin using the miniprep kit from Zymo Research, Irvine, California. We sent miniprep aliquots for Sanger DNA sequencing to the Iowa State University DNA Facility, Ames, Iowa.
Consensus Sequence Determination and Testing
Analysis of the sequencing data led to the development of a consensus sequence, called the pClone -35 Consensus. The consensus sequence formula of GA(T/C)A(A/T)A includes the four possible sequence variants GATAAA, GATATA, GACAAA, and GACATA. To test their functions, we incorporated them into the sequence of Ptac and cloned them into pClone Red. We sought to test the effect of promoter sequences surrounding the -35 region by embedding the four consensus sequence variants into two new promoter contexts that are very different from Ptac and from each other. As a starting point for designing the two new promoters, we used a consensus sequence developed from a mutational analysis of the sequences before and after the -35 region, reported as
(5’- TWNWNNNNAWWWNNTTCTTGACATNTTNNNNNNNWTRTGRTATAATDNNNNNRTWW -3’)
(De Mey, Lequeux, Maertens, Soetaert, & Vandamme, 2007a). Our first set of rules to specify the bases was W=A, N=G, R=G, and D=G, while avoiding runs of 4 or more Gs or Cs. This resulted in Psimp1, whose sequence is
(5’- CGACGAGGCCGAAAAGGTTCTTGACATGTTGGCGGCGATGTGGTATAATGGCGGCGTAA -3’).
The second set of rules we applied was W=T, N=C, R=A, and D=C resulting in Psimp2, with the sequence
(5’- CGACCTCCGCATTTCCTTCTTGACATCTTCCGCCGCTTATGATATAATCCGCCCATTT- 3’).
We cloned the four pClone -35 consensus sequence variants GATAAA, GATATA, GACAAA, and GACATA, along with the original Ptac consensus of TTGACA, into Psimp1 and Psimp2 to produce a collection of ten new promoter variants. We quantified the strengths of the promoter variants by using RFP expression and compared the mean values for each of them with an unpaired t-test using a threshold for statistical significance of p = .05.
RESULTS
Mutant Promoter Library Construction and Exploration
Our primary research goal was to explore the effects of mutations in the -35 region of a bacterial promoter. We mutated each of the six bases in this region, producing a library of 46 or 4,096 mutant promoters. Figure 3 shows a picture of the plated library of clones on a UV light box. Unsuccessful GGA resulted in colonies that expressed the GFP gene, driven by the original backwards-facing promoter of the pClone Red plasmid. Successful GGA produced all of the colonies that do not show GFP expression, but have varying levels of RFP expression. As expected, mutations in the -35 region of the Ptac promoter yielded diverse promoter strengths, causing the varying RFP brightness of E. coli colonies on the plate.
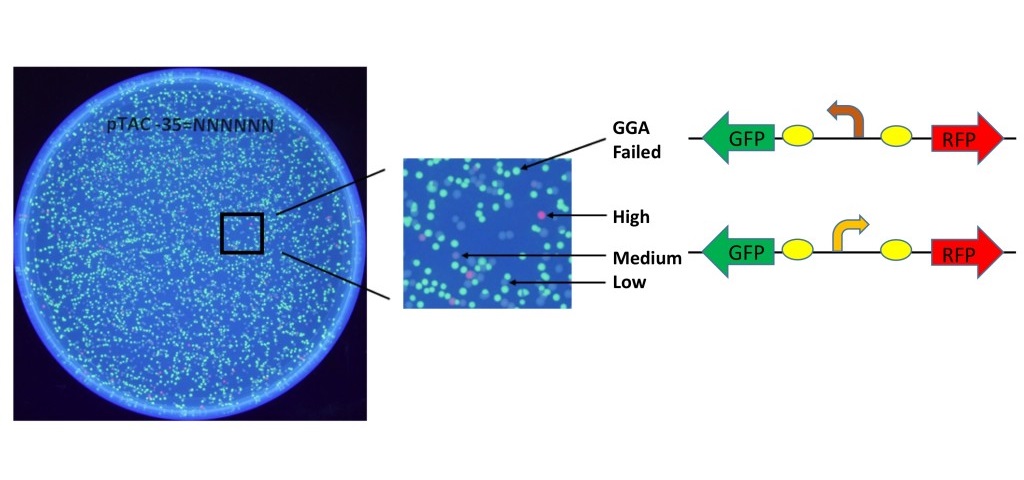
Figure 3. Library of mutant promoters. The -35 region of the Ptac promoter (TTGACA) was replaced with the sequence NNNNNN(N=A,T,C,G) to produce a library of 4,096 mutant promoters in pClone Red. Green colonies indicate failed GGA. Non-green colonies have variable RFP levels as determined by promoter strength.
Our collection of 81 promoters with their -35 region sequences is listed in Figure 4, along with their strengths, expressed as a ratio of the measured RFP production of each clone to that of Ptac. The 81 promoters covered a wide range of strengths, from 128% of the strength of Ptac to 0.9%. The mean RFP expression ratio of the 81 clones was 19.7 +/- 28.3, and the median RFP expression ratio was 7.3. Of the 81 clones, three have a promoter strength higher than Ptac, 12 have a strength at least 50% of Ptac, and 44 have a promoter strength less than 10% of Ptac.
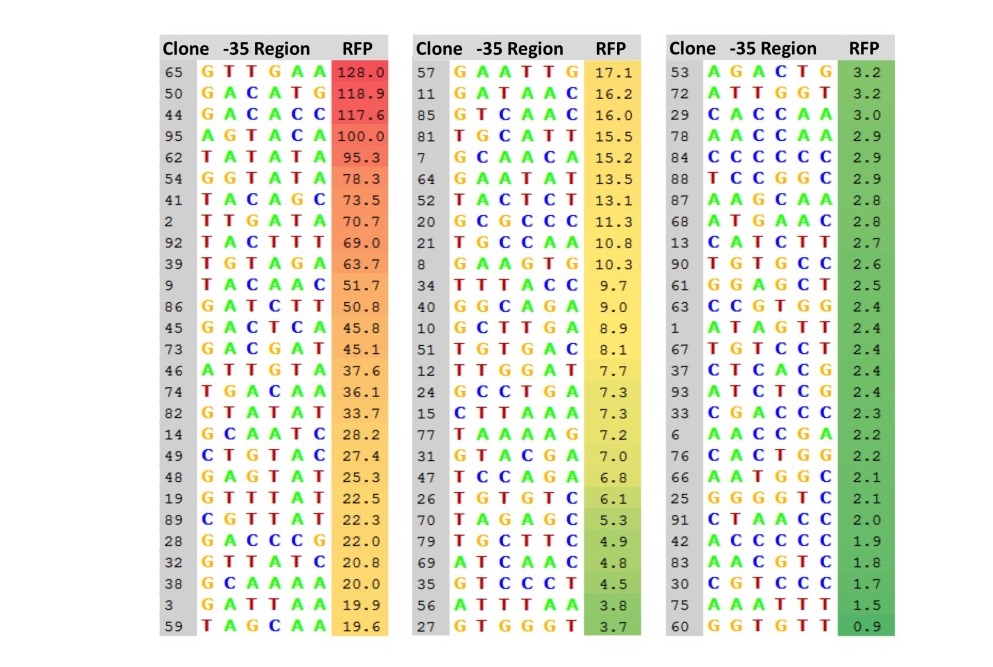
Figure 4. Collection of 81 mutant promoters. Eighty-one mutant promoter clones were selected from the pClone Red library. For each mutant promoter clone, the sequence of the -35 region is listed, along with its strength, expressed as the ratio of RFP expression compared toPtac.
Consensus Sequence Determination
Our examination of the sequences of the -35 regions from the 81 promoters listed in Figure 4 revealed patterns of bases required for high promoter strength. We captured these patterns by determining a consensus sequence. Consensus sequences are usually determined by analyzing the top 5-20% of the promoters (Estrem, Gaal, Gourse, & Ross, 1998). We used this method to determine a consensus sequence from the 12 mutant promoters that had a strength of 50% or higher compared to Ptac. The resulting Preliminary pClone -35 Consensus is shown in Figure 5B. It differs considerably from the published -35 consensus shown in Figure 5A, which was derived from 263 E. coli promoters (Harley & Reynolds, 1987). Specifically, the first, second, third, and fifth bases differ between the two consensus sequences.
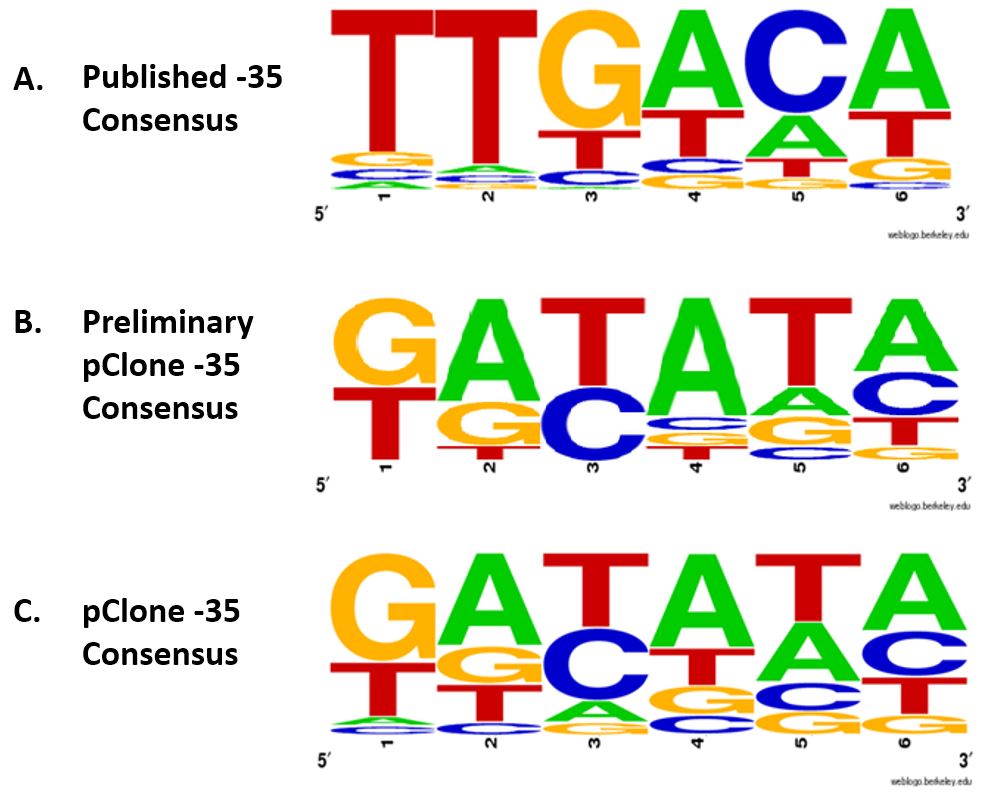
Figure 5. Consensus sequences of the -35 region. (A) Published -35 consensus based on 263 naturally occurring E. coli promoters (Harley & Reynolds, 1987); (B) Preliminary pClone -35 consensus was determined from the the top 12 mutant promoters with >50% efficiency compared to Ptac; (C) pClone -35 consensus was determined from sequences found in all 81 selected promoters. using a weighted consensus method.
To use the information collected for all of the 81 promoter sequences, we developed a new method of consensus building. Our weighted consensus method allows each base in each position to make contributions to the consensus that are proportional to the strength of the promoter in which it is found. Our method assigns a score to each base in each position based on the RFP expression of the mutant promoter that contained it. For example, for mutant promoter number 65, which had a promoter strength of 128, the G in the first position received 128 points for that promoter. The T in the second position of promoter number 65 also received 128 points, as did the bases in the remaining four positions. For promoter number 50, which had a promoter strength of 118.9, the G in the first position received 118.9 points, as did the C in the second position and the other bases in their respective positions.
We totaled the points received by each of the four bases for all six positions and used the totals to produce a consensus sequence. For the first position, the total for G, T, C, and A were 1008, 512, 84, and 76, respectively. The weighted consensus method resulted in the pClone -35 Consensus shown in Figure 5C. The pClone -35 Consensus sequence is similar to the Preliminary pClone -35 Consensus sequence but differs significantly from the Published -35 Consensus sequence.
Testing the pClone Consensus Sequence
Because our synthetic pClone -35 consensus sequence differed from the natural published -35 consensus sequence, we designed experiments to test it. We used the pClone -35 Consensus presented in Figure 5C to develop the consensus formula of GA(T/C)A(A/T)A. This consensus formula has the four consensus sequence variants of GATAAA, GATATA, GACAAA, and GACATA. We incorporated these four variants into the original pTac promoter for testing. In order to test the effect of promoter sequences surrounding the -35 region, we also incorporated the four consensus sequence variants into two additional promoters designed on the basis of a structural blueprint derived from mutational analysis in E. coli of the sequences before and after the -35 region (De Mey et al., 2007a). As described in Materials and Methods, we used the consensus sequence from (De Mey et al., 2007) to design two new promoters called Psimp1 and Psimp2. Figure 6 shows the RFP results after cloning the original Ptac -35 region sequence of TTGACA and the four pClone -35 consensus sequence variants GATAAA, GATATA, GACAAA, and GACATA into Ptac, Psimp1, and Psimp2. In the context of Ptac, the four consensus sequence variants have promoter strengths relative to Ptac that range from 21.6 to 167.1. The mean strength of the four sequence variants in Ptac was 99.0 +/- 66.4. In the context of Psimp1, the four variants had a mean promoter strength of 85.8 +/- 63.9. An unpaired t-test showed that the difference between this mean and the mean for Ptac is not statistically significant (p = .785). The range of the efficiencies in Psimp1 was 28.6 to 174.6. In Psimp2, the mean promoter strength of the four variants was 20.0 +/- 8.5. This mean is lower than the mean for Ptac, but an unpaired t-test showed that the difference is not statistically significant (p = .056). The range for Psimp2 was from 10.9 to 27.6. When we consider the -35 region consensus variants cloned into each promoter as populations, an unpaired t-test fails to reveal a significant statistical difference among the three promoter contexts.
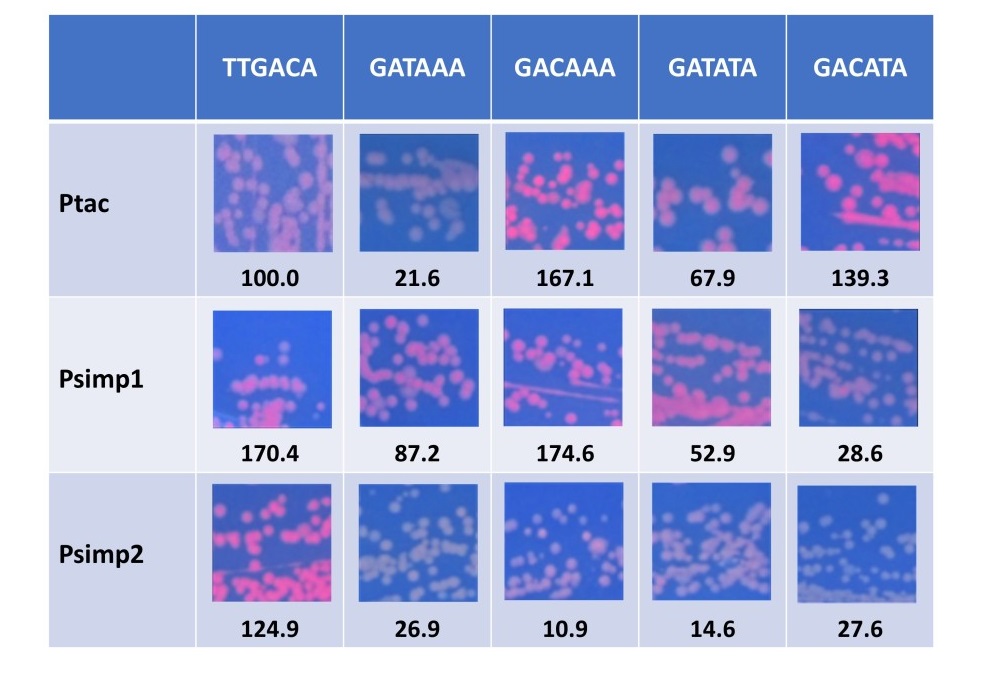
Figure 6. Promoter strengths of pClone -35 consensus variants in three sequence contexts. The pClone Red clones shown are the original Ptac -35 region sequence (TTGACA) plus four variants of the pClone -35 Consensus (G A AA) in the three contexts of Ptac, Psimp1, and Psimp2. The pictures were taken on a UV box to shown RFP expression. The numbers below each picture are the promoter strengths, expressed as the ratio of RFP expression compared to Ptac.
The alternative approach of considering each consensus variant in the three promoter contexts captures important differences among them. For instance, GATAAA produces a strength of 21.6 and 26.9 in Ptac and Psimp2, respectively, but a higher strength of 87.2 in Psimp1. GACAAA produces a strength of 167.1 and 174.6 in Ptac and Psimp1, respectively, but only 10.9 in Psimp2. The order of the sequence variants was different for each of the promoters. For Ptac, we found that GACAAA > GACATA > GATATA > GATAAA. It was GACAAA > GATAAA > GATATA > GACATA for Psimp1, and lastly, GACACA > GATAAA > GATATA > GACAAA for Psimp2. These results suggest that bacterial promoter strength is a function of the sequence of the -35 region and the sequence context surrounding it.
DISCUSSION
Implications for Understanding the Initiation of Bacterial Transcription
Although the core RNA polymerase with its five subunits is responsible for the production of RNA during transcription in E. coli and most bacteria, initiation of transcription requires its association with a subunit called the sigma factor (Gross et al., 1998). The primary sigma factor, sigma 70, initiates transcription of genes needed during exponential growth. The sigma factor enables binding of the RNA polymerase to the -10 region and -35 region of promoters. A conserved domain of sigma factor proteins, region 4.2, is a helix-turn-helix structural motif that contains amino acids that make contact with bases and phosphates on both strands of the -35 region (Gruber & Gross, 2003). When the nascent RNA is five to ten nucleotides long, the sigma factor dissociates from the RNA polymerase. The core RNA polymerase continues with the production of an RNA transcript in the absence of sigma factor. Initiation frequency is responsive to the promoter sequence and can vary over three orders of magnitude (Record et al., 1996). The prevailing view of how promoter strength varies in bacterial genomes is that the strength of sigma factor binding to a particular promoter depends on how closely it matches the consensus sequence. For the -35 region, this would be interpreted in terms of matches to the consensus sequence of TTGACA for E. coli promoters. The variety of -35 region sequences also is likely to be affected by the repeated use of promoter elements during evolution of the E. coli genome. Our study can be viewed as having removed this evolutionary historical bias, revealing the true E. coli consensus sequence by which promoter strength is determined. Removing the historical constraints leads to an alternative testable hypothesis in which the extent to which a particular promoter matches the pClone -35 consensus of GA(T/C)A(A/T)A determines its strength.
E. coli has six sigma factors in addition to sigma 70, that recognize -35 region sequences. Alternative sigma factors enable coordinate transcription from genes needed for responses to heat shock, starvation, and nitrogen limitation (Gross et al., 1998). The seven different sigma subunits in E. coli are used in a global regulatory capacity. Each of the E. coli sigma factors binds to a slightly different -35 region sequence. For example, the consensus sequence is TTGACA for sigma 70, CCCTTGAA for sigma 32, CTGGNA for sigma 54, and CTAAA for sigma F (Gruber et al., 2003). The E. coli genome contains more copies of the TTGACA -35 region sequence, since it is used for housekeeping genes. This biases the frequency distribution of -35 region sequences in favor of TTGACA (Harley & Reynolds, 1987; Lisser & Margalit, 1993). Our experimental approach may have removed the bias for TTGACA and allowed increases in the frequency of binding sites for one or more of the other six sigma factors. The result of alternative sigma factor binding would be a change in the consensus sequence away from TTGACA and toward the sequences required for alternative sigma factor binding. The in vivo binding sites for several alternative sigma factors have not been determined. If the RFP production differences between our pClone -35 consensus and the published one are due to interactions between our mutant promoters and alternative sigma factors, they will provide insight into the binding sites for alternative sigma factors. Since our pClone -35 consensus is GA(T/C)A(A/T)A compared to the sigma 70 binding site of TTGACA, the first, second, third, and sixth positions may be interacting with alternative sigma factors.
Contributing a New Promoter Set to Databases
In synthetic biology, a collection of promoter sequences of varying strengths can be a very valuable asset. To share our collection of promoters with the worldwide synthetic biology community of researchers, we contributed three pages to the Registry of Standard Biological Parts which contains the largest collection of synthetic biology DNA parts in existence, with over 7,000 DNA parts (MIT Working Group, 2005). We contributed a page to the Registry of Standard Biological Parts as part number J119375 (http://parts.igem.org/Part:BBa_J119375). The Psimp1 and Psimp2 promoters with 4 consensus variants each are presented in the Registry as part number J119376 (http://parts.igem.org/Part:BBa_J119376) and J119377 (http://parts.igem.org/Part:BBa_J119377), respectively. We also contributed information about our promoters to a new database called the Registry of Functional Promoters (RFP; http://gcat.davidson.edu/RFP/). RFP is a database that allows high school and undergraduate students to share information about promoters that they have cloned and studied using the pClone Red system. A third database to which we submitted information about the promoters is called the GCAT-alog (http://gcat.davidson.edu/GCATalog/). This database contains information about the freezer location of clones that synthetic biologists can access in order to share DNA parts and devices with each other.
Applications Using Promoters with Varying Strengths
The results of our study provided sequences and promoter strengths for a collection of 81 newly cloned promoters. An additional 19 promoters with changes in their -35 and -10 regions have been part of the Registry of Standard Biological Parts since 2004 (MIT Working Group, 2005). The sequence of each mutant promoter is presented along with relative strengths determined by RFP expression data (http://parts.igem.org/Part:BBa_J23100). There is also a collection of 14 promoters of varying strengths in a paper published in 2011 (Davis, Rubin, & Sauer, 2011). In synthetic biology, users can pick and choose promoters with different strengths for use in a wide range of synthetic biology applications. In the field of medicine, synthetic biology has been used to improve diagnosis and make medical treatments more effective with new drug discovery and drug delivery (Collins & Khalil, 2010). These applications rely on well characterized promoter functionality. The tuning of synthetic biology devices with promoters of various strengths is fundamental to the growing field of biological engineering. Synthetic biology is also being used to develop microbial systems for biofuel production (Deng, Guo, Liu, Tao, & Zhang, 2015). The production of biofuels using microbial cells requires promoters with various strengths to control the transcription of genes that encode enzymes in biofuel metabolic pathways. Metabolic engineers have also repurposed naturally occurring metabolism in order to convert inexpensive starting materials into valuable metabolites (Keasling, 2010). Promoters of various strengths can be used to balance the desired orthogonal metabolic output with the metabolic cost to the bacteria (Eckdahl et al., 2015).
Future Prospects for Mutational Analysis of Bacterial Gene Expression
The pClone Red system facilitates further investigation of the initiation of transcription in bacteria. Our results showing the effects of -35 region sequence context indicate that we do not fully understand the effects of sequences upstream and downstream of the -35 region. Production of pClone Red libraries with variations in nearby sequences would enable the collection of promoter strength data and the development of consensus sequences for the upstream and downstream elements. Our approach of producing a library of mutant promoters by mutation of the -35 region of Ptac could also be adapted to the -10 region of Ptac or another promoter. Comparison of the resulting consensus sequence to the published consensus of TATAAT would add insight into the role of the -10 region in the initiation of transcription. In addition, the pClone Red system could be used to study regulated promoters, in contrast to constitutive promoters such as Ptac. It is also possible for mutations to be introduced into Ptac or other promoters that reduce or increase the distance between the -35 region and the -10 region.
While constitutive promoters initiate transcription at a constant level, regulated promoters respond to internal or external cues. The regulation usually occurs by the binding of a regulatory protein to a DNA sequence found in or near a transcriptional promoter. Repressor regulatory proteins turn off the initiation of transcription while activators turn it on. Each of the two types of regulatory proteins can exist in either of two structural forms, one that binds DNA and one that does not. This mechanism occurs when small molecules bind to the regulatory proteins and affect which structural form they adopt. The pClone Red system could be used to interrogate the sequence requirements for repressor or activator binding or the effect of -35 region or the -10 region sequences on regulation.
We have extended our pClone Red approach to the design and construction of systems for mutational analysis of other aspects of the regulation of bacterial gene expression. The tClone Red plasmid employs GGA to easily clone transcriptional terminators found at the ends of bacterial genes. Terminators function by the formation of base-paired stem and loop structures in the RNA that destabilize its interaction with the DNA template, causing RNA polymerase to terminate transcription (Cambray et al., 2013). Terminators are found upstream of genes as part of riboswitches, which can control gene expression by adopting alternative RNA folding structures. Both terminators and riboswitches are useful in synthetic biology (Batey, Ceres, Garst, & Marcano-Velázquez, 2013). The tClone Red plasmid permits the study of structure/function relationships in terminators and riboswitches. We have also designed and built rClone Red, which allows the study of ribosome binding sequences, or RBSs. RBSs are found about 6 bases upstream of the start codon and control the initiation of translation by base pairing with the 5’ end of the 16S ribosomal RNA of the small ribosomal subunit (Laursen, Sørensen, Mortensen, & Sperling-Petersen, 2005). In addition, riboswitches can use RBSs, adopting a structure that sequesters them or makes them available. Collections of RBSs with various strengths and riboswitches that are controlled by various metabolites are very useful to synthetic biologists (Khalil & Collins, 2010). The rClone Red plasmid allows the production of these collections as well as mutational analysis of both RBSs and riboswitches.
ACKNOWLEDGEMENTS
We would like to thank Dr. Jay Meyers of Saint Joseph Central High School for his support and Dr. A. Malcolm Campbell of Davidson College for his advice on the experimental approach and helpful comments on the manuscript. Support from National Science Foundation (http://www.nsf.gov/) RUI grant MCB-1329350 to Missouri Western State University is gratefully acknowledged.
REFERENCES
Beales, N. (2004). Adaptation of Microorganisms to Cold Temperatures, Weak Acid Preservatives, Low pH, and Osmotic Stress: A Review. Comprehensive Reviews in Food Science and Food Safety, 3(1), 1–20. http://doi.org/10.1111/j.1541-4337.2004.tb00057.x
Cambray, G., Guimaraes, J. C., Mutalik, V. K., Lam, C., Mai, Q.-A., Thimmaiah, T., . . . & Endy, D. (2013). Measurement and Modeling of Intrinsic Transcription Terminators. Nucleic Acids Research, 41(9), 5139–5148. http://doi.org/10.1093/nar/gkt163
Campbell, A. M., Eckdahl, T., Cronk, B., Andresen, C., Frederick, P., Huckuntod, S., . . . & Yuan, J. (2014). pClone: Synthetic Biology Tool Makes Promoter Research Accessible to Beginning Biology Students. CBE Life Sciences Education, 13(2), 285–296. http://doi.org/10.1187/cbe.13-09-0189
Ceres, P., Garst, A. D., Marcano-Velázquez, J. G., & Batey, R. T. (2013). Modularity of select riboswitch expression platforms enables facile engineering of novel genetic regulatory devices. ACS Synthetic Biology, 2(8), 463–472. http://doi.org/10.1021/sb4000096
Cho, I., & Blaser, M. J. (2012). The human microbiome: at the interface of health and disease. Nature Reviews Genetics, 13(4), 260–270. http://doi.org/10.1038/nrg3182
Davis, J. H., Rubin, A. J., & Sauer, R. T. (2011). Design, construction and characterization of a set of insulated bacterial promoters. Nucleic Acids Research, 39(3), 1131–1141. http://doi.org/10.1093/nar/gkq810
De Boer, H. A., Comstock, L. J., & Vasser, M. (1983). The tac promoter: A functional hybrid derived from the trp and lac promoters. Proceedings of the National Academy of Sciences of the United States of America, 80(1), 21–25.
De Mey, M., Maertens, J., Lequeux, G. J., Soetaert, W. K., & Vandamme, E. J. (2007a). Construction and model-based analysis of a promoter library for E. coli: an indispensable tool for metabolic engineering. BMC Biotechnology, 7, 34. http://doi.org/10.1186/1472-6750-7-34
De Mey, M., Maertens, J., Lequeux, G. J., Soetaert, W. K., & Vandamme, E. J. (2007b). Construction and model-based analysis of a promoter library for E. coli: an indispensable tool for metabolic engineering. BMC Biotechnology, 7, 34. http://doi.org/10.1186/1472-6750-7-34
Eckdahl, T. T., Campbell, A. M., Heyer, L. J., Poet, J .L., Blauch, D. N., Snyder, . . . Whitesides, E. T. (2015). Programmed evolution for optimization of orthogonal metabolic output in bacteria. PLoS One, 10(2), e0118322. http://doi.org/10.1371/journal.pone.0118322
Estrem, S. T., Gaal, T., Ross, W., & Gourse, R. L. (1998). Identification of an UP element consensus sequence for bacterial promoters. Proceedings of the National Academy of Sciences of the United States of America, 95(17), 9761–9766.
Gross, C. A., Chan, C., Dombroski, A., Gruber, T., Sharp, M., Tupy, J., & Young, B. (1998). The Functional and Regulatory Roles of Sigma Factors in Transcription. Cold Spring Harbor Symposia on Quantitative Biology, 63, 141–156. http://doi.org/10.1101/sqb.1998.63.141
Gruber, T. M., & Gross, C. A. (2003). Multiple Sigma Subunits and the Partitioning of Bacterial Transcription Space. Annual Review of Microbiology, 57(1), 441–466. http://doi.org/10.1146/annurev.micro.57.030502.090913
Gurdon, J. B., & Melton, D. A. (2008). Nuclear Reprogramming in Cells. Science, 322(5909), 1811–1815. http://doi.org/10.1126/science.1160810
Harley, C. B., & Reynolds, R. P. (1987). Analysis of E. coli promoter sequences. Nucleic Acids Research, 15(5), 2343–2361.
Keasling, J. D. (2010). Manufacturing molecules through metabolic engineering. Science, 330(6009), 1355–1358. http://doi.org/10.1126/science.1193990
Khalil, A. S., & Collins, J. J. (2010). Synthetic biology: applications come of age. Nature Reviews Genetics, 11(5), 367–79. http://doi.org/10.1038/nrg2775
Khalil, A. S., & Collins, J. J. (2010). Synthetic biology: applications come of age. Nature Reviews Genetics, 11(5), 367–379. http://doi.org/10.1038/nrg2775
Kobayashi, M., Nagata, K., & Ishihama, A. (1990). Promoter selectivity of Escherichia coli RNA polymerase: effect of base substitutions in the promoter −35 region on promoter strength. Nucleic Acids Research, 18(24), 7367–7372. http://doi.org/10.1093/nar/18.24.7367
Laursen, B. S., Sørensen, H. P., Mortensen, K. K., & Sperling-Petersen, H. U. (2005). Initiation of Protein Synthesis in Bacteria. Microbiology and Molecular Biology Reviews, 69(1), 101–123. http://doi.org/10.1128/MMBR.69.1.101-123.2005
Lisser, S., & Margalit, H. (1993). Compilation of E.coli mRNA promoter sequences. Nucleic Acids Research, 21(7), 1507–1516. http://doi.org/10.1093/nar/21.7.1507
López-Bigas, N., & Ouzounis, C. A. (2004). Genome-wide identification of genes likely to be involved in human genetic disease. Nucleic Acids Research, 32(10), 3108–3114. http://doi.org/10.1093/nar/gkh605
MIT Working Group. (2005). Registry of Standard Biological Parts. Retrieved September 2, 2015, from http://partsregistry.org/Main_Page
Ponnambalam, S., Webster, C., Bingham, A., & Busby, S. (1986). Transcription initiation at the Escherichia coli galactose operon promoters in the absence of the normal -35 region sequences. Journal of Biological Chemistry, 261(34), 16043–16048.
Ross, W., Aiyar, S. E., Salomon, J., & Gourse, R. L. (1998). Escherichia coli Promoters with UP Elements of Different Strengths: Modular Structure of Bacterial Promoters. Journal of Bacteriology, 180(20), 5375–5383.
Tao, H., Guo, D., Zhang, Y., Deng, Z., & Liu, T. (2015). Metabolic engineering of microbes for branched-chain biodiesel production with low-temperature property. Biotechnology for Biofuels, 8, 92. http://doi.org/10.1186/s13068-015-0270-7
Waterman, M. S., Arratia, R., & Galas, D. J. (1984). Pattern recognition in several sequences: Consensus and alignment. Bulletin of Mathematical Biology, 46(4), 515–527. http://doi.org/10.1007/BF02459500
Weber, E., Gruetzner, R., Werner, S., Engler, C., & Marillonnet, S. (2011). Assembly of designer TAL effectors by Golden Gate cloning. PLoS One, 6(5), e19722. http://doi.org/10.1371/journal.pone.0019722