
Author: Aliya Babul
Institution: University of Toronto
ABSTRACT
Nuclear magnetic resonance (NMR) can provide incredible insight into chemical changes that occur in biological tissues under closed conditions. Utilizing NMR can lead to a better understanding of the breakdown of chemicals in a biological substance which in turn can help determine expiry dates and optimal storing conditions for a variety of substances ranging from fruits and vegetables to medical materials. In this experiment, NMR was applied to examine the effect of storage time on chemical and physical properties of orange juice pulp. Orange flesh was stored in a sealed container under unchanged conditions and the spin-spin relaxation time of hydrogen nuclei was measured over several days with the spin-echo method. The function of the spin-spin relaxation time versus time of observation was found to be a combination of two linear sections with significantly different slopes. Specifically, it was found that the spin spin relaxation time increased with age which indicated that chemical reactions were taking place in the juice as it aged.
INTRODUCTION
Research into the changes that occur in food products over time provides a better understanding of the biochemical mechanisms within food items, leading to the development of more accurate methods of determining expiry dates and shelf life. The nuclear magnetic resonance (NMR) spin-echo is a method that has improved understanding of changes in fruit and vegetable tissues under different environments and conditions.
In this method, a sample is placed into a strong, uniform magnetic field of a permanent magnet. Magnetic moments and spin angular momenta of hydrogen nuclei tend to precess about the direction of the external magnetic field. Averaged in time, the spins are aligned with the external magnetic field. Application of a pulse of radio frequency electromagnetic field destroys the initial alignment of the spins. After the pulse, the nucleus returns to its equilibrium state during a specific relaxation time. This time depends on the hydrogen neighbors – the other atoms of a molecule or a lattice.
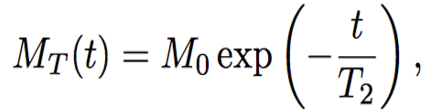
The spin echo method studies the relaxation time of the hydrogen nucleus after two consecutive pulses of the electromagnetic field. The first pulse changes the direction of the spin by π/2, and the second pulse, sent in time τ after the first one, changes the new direction of the spin by π. In same time, interval τ, the moments return to their equilibrium state in a process known as relaxation. As a result of the state change, the nucleus emits radiation called the spin echo (Figure 1). By applying several pulse sequences, the magnetization of the moments or amplitude of the spin echo signal decays with time. This decay is the T2 time (Figure 2). The decay of the magnetization of the moments is related to the spin-spin relaxation time T2 (Esmail, 2010) by the following equation,

The solution to the differential equation gives (Esmail, 2010):
As the equations show, the magnetic field is proportional to the time interval and T2 can be determined. Since both voltage and magnetic field are related to the height of the spin echo, in this case, they can be used interchangeably.
Since the development of NMR, several studies have looked into the impact of different temperatures on spin-spin relaxation time of hydrogen in fruits and vegetables. Chen, McCarthy, Kauten, Sarig, and Han (1993) used NMR to look at the changes occurring in the development of avocados, while Gamble (1994) looked at the changes in blueberries that occur when they are subjected to freezing temperatures and then examined. Ghambir et al. (2005) also studied the impact of freezing on fruits, studying the changes in spin-lattice and spin-spin relaxation of the flesh and peel of an orange under different temperatures. However, very little research has been done on the impact of storage time on spin-spin relaxation times. The present study examines the changes that occur in the spin-spin relaxation time of an orange flesh under unchanged physical conditions over the course of several days.
MATERIALS & METHODS
Originally grown in San Francisco, the oranges used in the present study were bought from the Real Canadian Superstore (Brampton, CA: Loblaw Companies Ltd.) and stored for 2d at room temperature. The oranges were then sliced in half and the flesh was pressed into plastic containers. The excess water was drained out, and the containers were sealed. Samples were stored at a room temperature of approximately 20°C.The pH of the orange flesh was tested on the first and final days of the experiment using pH strips (Waterloo, ON: Indigo Instruments). A series of spin relaxation measurements were taken over five days.

Figure 1. The spin echo occurs at 2τ. Initially a 90° pulse is transmitted and the spins line up in phase. Once the pulse has been delivered, the spins begin to de-phase and this decay is seen as the Free Induction Decay (FID). The transmission of a second 180° pulse causes the spins to flip and they begin to line up in phase until at 2τ there is an echo.

Figure 2. T2 decay as a function of the envelope of the spin echoes. With each spin echo, the signal decreases in strength. The T2 depends on the signal decrease with each subsequent spin echo while T2* depends on the decay of the signal for each individual spin echo.
A Tektronix TDS1012B Oscilloscope (Beaverton, OR: Tektronix) and type SIP4 spin lock controls were used to analyze signals from the probe. As data were taken, a Carr-Purcell (Perepelitsa. 2010) pulse sequence was applied. Since a Carr-Purcell pulse sequence was used, the first pulse of the sequence was be applied every 6s, while the second pulse was applied every 20ms and lasted for 3s. The data were then entered into a Python code, which plotted the voltage versus time and the natural logarithm of voltage versus time (Figure 3). Using a Hilbert transformation (Thrane et al.,1983), the envelope of the data was plotted as:
The Hilbert transformation allows a function with time as the independent variable to be transformed into a complex function, thus enabling the determination of the envelope (Figure 4)
Evaluating the integral in Equation 3 as a Cauchy Principle value allows it to be written as:

By the convulsion theorem, the function is then evaluated as the transformation of f(x) with i wisgn(x):
After the envelope was created, the plot was linearized using the natural logarithm. Because the Carr-Purcell sequence that was used causes a spin echo to appear at every 2τ, the slope of the line represents 2/T2 (Duarte & Campbell, 2008). Using Equations 1 and 2, The final result of code was a linearized graph of the natural logarithm of voltage vs. time (Figure 5). In addition, a paired t-test was performed between the data set for the first and last day in order to evaluate the statistical significance of the results.
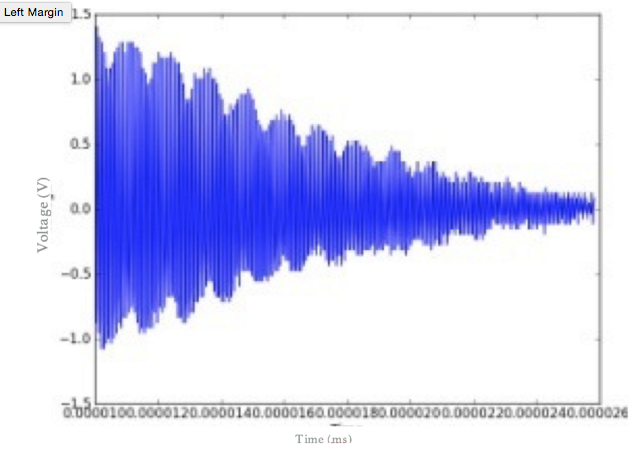
Figure 3. Voltage of a juice sample as a function of time. Peaks in the voltage display the presence of spin echoes that are occurring through time. The voltage decreases with time, indicating the decay in signal strength with each spin echo. The decay in the envelope of the spin echo heights will give the T2 time.

Figure 4. Envelope of the voltage of the spin echoes as a function of time. A Hilbert transform was used to take the envelope of the spin echo heights from Figure 3. The decay constant of the decrease of the voltage is how T2 is determined. The decay of the envelope of the voltage can be modeled by V(t) = beat where a is the decay constant and is related to T2 time by a = -1/T2.

Figure 5. Natural logarithm of the envelope of voltage as a function of time. Since the envelope of the voltage is an exponential decay as a function of time, taking the natural logarithm of the voltage envelope straightens the curve. The blue line represents the straightened curve of the voltage envelope. The red line represents the line of best fit. The function for voltage can now be modeled by ln (v(t)) = ln (b) + at , where a is the slope of the line and is related to the T2 value by a = -1/T2.
RESULTS
Five trials were run for each of the five days of data collection. The average spin-spin relaxation for each day is as follows: 120.5ms, 129.6ms, 170.4ms, and 196ms.
Spin-spin relaxation time increased as a function of time (Figure 6). Graphing these times logarithmically indicates that the T2 time increases exponentially with the storage time of the juice (Figure 67).
A paired t-test performed between the results of the first and last day of the experiment yielded a p-value of p < .04. This indicates that the results were significant (p < .05) and that the spin echo measurement is a good indication of the age of the juice.
The pH measurements performed on the first and last days of the experiment showed that the acidity of the juice remained relatively unchanged over the course of the experiment, never straying from 4 ± 1. A large uncertainty was assumed because the color Indigo pH strips that were used could only indicate a whole number pH value.
DISCUSSION
Overall, the spin-spin relaxation time T2 increased logarithmically with the length of time of the flesh of an orange is stored. We postulate that this may be a result of the different phases of the fermentation process. During the first stage, the sugars are broken down into smaller molecules known as pyruvic acids, decreasing the glucose concentration within the orange (Carter,1995). This is reflected in the small increase in the spin-spin relaxation time in the first few days of the experiment. Studies such as that by Rao, Sudaromoorthy, and Arulhozhi (1990) have shown that decreasing the concentration of glucose in a solution increases the spin-spin relaxation time.

Figure 6. Spin-spin relaxation as a function of the time the sample has been in the storage container. For each sample, the spin-spin relaxation time was measured at several time points over the course of several days. The average of the spin-spin relaxation for each time point was plotted as a function of time.

Figure 7. Natural logarithm of average spin-spin relaxation as a function of the time the sample has been in the storage container. By taking the natural logarithm of the average spin-spin relaxation of the samples as a function of time they have been contained, the curve is linearized. The red line represents the line of best fit.
In the second stage of the fermentation, the acids are converted into ethanol. Tellier, Guillou-Charpin, Grenier, and Botlan (1989) found that the spin-spin relaxation times for 20% glucose and 10% ethanol solutions, with the presence of a relaxation agent, were 110ms and 260ms, respectively. The high spin-spin relaxation times for ethanol solutions are likely reflected in the exponential increase of spin-spin relaxation times in the latter part of the experiment. Orange flesh contains a number of other chemicals, such as potassium and sodium, that may act as relaxation agents, thus producing similar results to the Tellier et al. study (1989). In addition, the study showed the solution containing more glucose had a smaller time T2 than the solution containing ethanol, further agreeing with our result that as the fermentation process proceeds, increasing the alcohol level, the T2 value increases. Finally, a study done by Govindaraju, Meyerhoff, Maudsley, Vermathen, and Weiner (1997) looking at the spin-spin relaxation times of ethanol in biological samples found that the spin-spin relaxation time of the ethanol in 25% biological tissue was 271ms. This value, is also very similar to the average values determined in this study.
Although the values found in this experiment differ from those observed by Gambhir et al. (2005), this may have been a result of the fact that the excess water was removed from the flesh, while Gambhir et al. allowed the water to remain and thus had a higher T2 time of 1010ms. Our results, however, are very similar to the T2 of lemon flesh found by Bartusek and Smekal (2006), which was 281ms.. Further research should be performed to examine whether levels of glucose and alcohol in the flesh of a fermenting orange is indeed the cause of the changes in spin-spin relaxation time.
ACKNOWLEDGEMENTS
I would like to thank Professor Natalia Krasnopolskaia for overseeing and supporting this research. I would also like to thank the University of Toronto Physics department for the fellowship opportunity that enabled me to conduct this research.
REFERENCES
Bartusek, K., & Smekal, Z. (2006). Processing of NMR images weighted by relation time T2 to increase their resolution. Measurement Science Review, 6(2), 10-15.
Carter, J.S. (1995). Cellular Respiration and Fermentation. Retrieved from http://biology.clc.uc.edu/courses/bio104/cellresp.htm.
Chen, P., Mcarthy, M. J., Kauten, R., Sarig, Y., & Han, S. (1993). Maturity evaluation of avocados by NMR methods. Journal of Agricultural Engineering Research, 55(3), 177-187.
Duarte, J.M.G., & Campbell, S.L. (2008). Pulsed Nuclear Magnetic Resonance: Spin Echoes. Retrieved from http://web.mit.edu/8.13/www/JLExperiments/JLExp12.pdf.
Esmail, A. (n.d.). E1: Pulsed NMR at 15MHz. Retrieved from http://ae287.user.srcf.net/Reports/PulsedNMR_Public.pdf.
Gambhir, P.N., Choi, Y.J., Slaughter, C.D., Thompson, J.F., James, & McCarthy, M.J. (2005). Proton Spin-Spin relaxation time of peel and flesh navel orange varieties exposed to freezing temperatures. Journal of the Science of Food and Agriculture ,85(14), 2484-2486.
Gamble, G.R. (1994). Non-invasive determination of freezing effects in blueberry fruit tissue by magnetic resonance imaging. Journal of Food Science, 59(3), 571-573.
Govindaraju ,V. , Meyerhoff, D.J., Maudsley, A.A., Vermathen, M., & Weiner,M.W. (1997). Effects of Brain Membranes on H Nuclear Magnetic Resonance Signal Intensity of Ethanol in Vitro. Alcohol and Alcoholism, 32, 671-681.
Perepelitsa, D. (2010). Pulsed NMR Spin Echoes. Retrieved from http://web.mit.edu/dvp/www/Work/8.14/dvp-nmr-paper.pdf.
Rao, S. A., Sudaromoorthy, A., & Arulmozhi, V. (1990). Proton magnetic resonance relaxation studies in aqueous solutions of alkali halides and fructose. Journal of Molecular Liquids, 45(3-4), 231-236.
Tellier, C., Guillou-Charpin, M., Grenier, P., & Botlan, D. L. (1989). Monitoring alcoholic fermentation by low resolution pulsed nuclear magnetic resonance. Journal of Agricultural and Food Chemistry, 37(4), 988-991.
Thrane, N., Wismer, J., Konstantin-Hanse, H.,& Gade, S.(1983). Practical Use of the Hilbert Transform. Retrieved from http://www.bksv.com/doc/bo0437.pdf.