
Author: Elaine Dang
Institution: University of California, Los Angeles
Date: September 2008
Abstract
Successful endodontic treatment involves removal of necrotic tissue, bacterial infiltrates, and accumulated procedural debris. However, available irrigants may potentially cause postoperative pain which results in discomfort for the patients. This study aims to evaluate the quality of the current evidences that compared the mildness and antimicrobial activities of the most widely used endodontic irrigants: sodium hypochlorite and chlorhexidine gluconate. A Timmer analysis is performed in developing a best base series relevant to antibacterial effects of these two root canal irrigants. The research question for this study is stated as: "Will sodium hypochlorite compared to chlorhexidine reduce Entrococcus faecalis bacterial counts in the root canal space?" A comprehensive search of the literature was done through Medline using the flowing keywords: sodium hypochlorite, chlorhexidine gluconate, root canal irrigant, Entrococcus faecalis, anti-microbial activities, and toxicity. The results of this study shows that the best current evidence is that of an randomized, in vitro design which implies that an in vivo design and/or improved research methods need to be conducted in order to improve the current evidence.
Introduction
Numerous bacteria colonize the root canal space including Fusobacterium nucleatum, Eubacterium alactolyticum, E. nodatum, Lactobacillus casei, and Peptostreptococcus micros. Upon infection, the most common bacterial infiltrate is Enterococcus faecalis (E. faecalis). Endodontic procedures, or root canal therapy, are performed to treat the infection and seal the tooth against re-infection. Successful endodontic treatement involves removal of necrotic tissue, bacterial infiltrates, and accumulated procedural debris.
Root canal irrigants, used in endodontic procedures, include camphorated monchlorophenol, ethylenediaminetetraacetic acid (EDTA), formocresol, hydrogen peroxide, metacresylacetate, and sodium hypochlorite. Sodium hypochlorite (NaOCl) is the preferred irrigant to disinfect and remove procedural debris from the root canal space. NaOCl, however, has an unpleasant taste, is toxic in high concentrations, and has a limited bactericidal spectrum. Recently, chlorhexidine gluconate (CHX) has been introduced as a root canal irrigant. Compared to NaOCl, CHX is effective against E. faecalis, active postoperatively for up to 72 hours. These irrigants, however, may cause postoperative pain. Thus, root canal debridement requires an irrigant that demonstrates maximum bactericidal and cleansing activities. An irrigant must also reduce patient discomfort by minimizing tissue toxicity and inflammation.
The purpose of this study is to establish an acceptance score for a best case series in determining the antibacterial effects of two root canal irrigants: 5.25% sodium hypochlorite compared to 2% chlorhexidine gluconate. The findings are used to discuss the quality of evidence currently available for a subsequent systematic review.
Methods
PICO Analysis
PICO is an abbreviation for population (P), intervention (I), comparison (C), and outcome (O). This analysis includes the population studied, the interventions that are compared, and the outcome that is to be measured. For this research question, the population is inclusive of those studies that used human teeth as their samples, compared the interventions sodium hypochlorite to chlorohexidine gluconate, and measured of E. faecalis bacterial counts as the outcome.
Gathering Evidence
A comprehensive search of the literature was done to compile a case series relevant to the research question. A search of PubMed (NCBI, National Library of Medicine) online database, Medline, and the British Journal of Dentistry was performed using the following keywords: sodium hypochlorite, chlorhexidine gluconate, root canal, E. faecalis, and anti-microbial activities. The acquired abstracts were filtered using inclusion and exclusion criteria (Table 1)

Table 1. Inclusion and Exclusion Selectrion Criteria: These are the criteria used to select appropriate abstracts to answer the topic of interest. This analysis includes the population studied, the interventions that are compared, and the outcome that is to be measured
The inclusion criteria included those abstracts that used human teeth to compare the bactericidal, or anti-bacterial, activity of sodium hypochlorite to chlorhexidine gluconate. Antimicrobial activity was limited to measuring the reduction of E. faecalis counts. The exclusion criteria removed from the analysis those abstracts that used animal teeth to study other anti-bacterial or non-antibacterial irrigants, in reducing other bacteria infiltrates found in the root canal spaces. Also excluded were predictions that provided the probability of one or other interventions in reducing E. faecalis counts. From this process, an initial case series of abstracts was obtained. For the initial case series, a Timmer analysis (Timmer et.al., 2003) was performed to develop the best case series for a subsequent systematic review.
Timmer Analysis
The Timmer analysis consists of the Quality Assessment (QAS; Table 2), Study Design (SDS; Table 3), and Summary scores. The calculation of the QAS is accomplished for each abstract of the initial case series. The QAS instrument contains 19 items. The abstract is scored by each item according to if the item has been fully met: yes for 2 points, partial for 1 point, no for 0 points, and not applicable (N/A) for -2 points. The QAS is determined by the sum of all assigned points. The maximum QAS is 38 points. The SDS is determined by the type of study design with an additional point given if the study is randomized. The maximum SDS is 5 points for a randomized, human intervention study, or randomized clinical trial. Other study design categories will have a lesser maximum SDS. Thus, the highest scoring abstract, a randomized clinical trial, is awarded a QAS of 38 points and a SDS of 5 points for a total score of 43 points.

Table 2. Quality Assessment Score (QAS): Each abstract is rated based on the Quality Assessment Test. The QAS instrument contains 19 items. The abstract is scored by each item according to if the item has been fully met: yes for 2 points, partial for 1 point, no for 0 points, and not applicable (N/A) for -2 points. The QAS is determined by the sum of all assigned points. The maximum QAS is 38 points
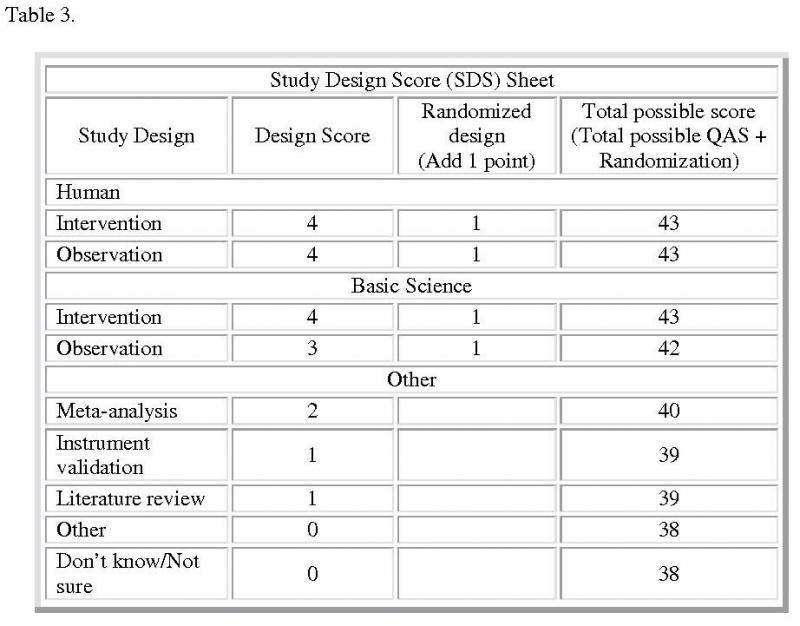
Table 3. Study Design Score Sheet: This sheet contains summary of all the accepted study designs and the type of designs each employed to complete the research. The maximum SDS is 5 points for a randomized, human intervention study, or randomized clinical trial
The Summary score (Figure 1) is a ratio of the awarded score (QAS + SDS) to the maximum possible points. The maximum possible points are again dependent on the individual study's design category. For example, the maximum possible points for a randomized clinical trial study design are 43 points. Other study design categories will have a lesser maximum possible points. Thus, the randomized clinical trial will have a Summary score of 1 and gives the highest level of evidence. Abstracts with a lower Summary score than 1 in their study design category indicates a study whose findings are less rigorous and subject to more variation. For all abstracts analyzed in this study, however, the denominator for calculation of the Summary score was chosen to be equivalent to the highest design category. Thus, all abstracts in the initial case series were analyzed against the highest level of evidence, the randomized clinical trial study design.

Figure 1. Calculation of Summary Score: Summary Score of each abstract is calculated as the sum of the Quality Assessment Score (QAS) and the Study Design Score (SDS) divided by the total possible score
Acceptance Score
The Acceptance score was arrived at by determining the average between the lowest and highest Timmer scores. The difference between these scores was divided by 2. The result was subtracted from the highest Timmer score to give the initial cut-off point in determining the Acceptance score. The initial cut-off point provided a threshold in separating acceptable from unacceptable research designs based on a midpoint of calculated scores. The research design attributes or characteristics were then analyzed. An evaluation was made to determine if the initial cut-off point produced an Acceptance score that still included unacceptable designs in comparison with that of the abstract with the highest Timmer score. If the initial cut-off point did so, then the cut-off point analysis was performed again. This process produced the final Acceptance score for acceptable research designs in producing best evidence from available research designs acquired at this time.
Results
Filtering unacceptable designs
The initial case series consisted of eight abstracts (Table 4). The research designs for the initial case series included in vitro and randomized in vitro studies. For each abstract, the research design describes its ranking on the hierarchical scale of acceptable designs (Figure 2).

Figure 2. Evidence Pyramid: The pyramid shows the different types of materials used in a research with the least clinically relevant at the bottom and the most clinically relevant at the top. The four layers at the top represent actual clinical research whereas the layers at the bottom are not as clinically relevant but can be used as guides in the initial research stages
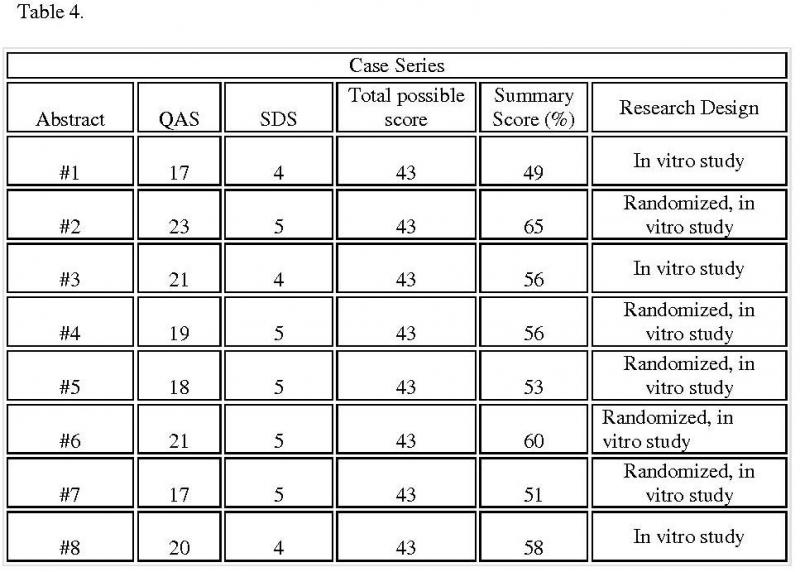
Table 4. Summary scores for selected case series: Table summarizes the score for each selected case series and also lists the methods each research used
From the Timmer analysis, the Summary score for each abstract of the initial case series ranged from 49% to 65%. The final cut-off point, and thus the Acceptance score, was determined to be 57%. However, Abstract 8 lacked randomization and was excluded from the best case series. Thus, the best case series included 2 abstracts with Summary scores ranging from 60% to 65% (Table 5).
The research designs of these accepted abstracts differed from the unacceptable designs in several respects.

Table 5. Summary scores for best-case series: Two best case series are selected based on the scores they received and the research designs employed
Lack of randomization and statistical tests
Of the abstracts with unacceptable designs, Abstracts 1, 3, and 8 lacked randomization. Randomization assures that each tooth has an equal and independent chance of being assigned to either irrigant test groups. Random allocation minimizes differences in tooth characteristics between the test groups and increases the reliability of the results. While Abstracts 1 and 3 described their findings, abstract 8 used appropriate statistical tests in reporting findings using p-values. Reporting findings in descriptive terms diminishes the ability to replicate findings, being subject to different interpretations. The remaining excluded abstracts were randomized. Abstracts 5 and 7, however, provided descriptive findings, and then, in minimal detail. Abstract 4 compared NaOCL to CHX. Yet, the outcome measured inflammatory changes rather than bacterial counts.
Determining the best-case series
As a result of the analysis, 2 out of the 8 abstracts were included in the best case series, 25% of the total abstracts in the initial case series. The best case series included Abstracts 2 and 6 (Table 5). Both abstracts had clearly stated objectives that supported the hypotheses provided. Sample size and statistical analyses were appropriate to reporting the study findings. Significant results were reported that were sufficiently detailed and included p-values. Finally, findings from Abstracts 2 and 6 could be applied to answering the research question (Table 6).

Table 6. Quality Assessment Scores Attributes: Table provides full explanations of the two scores and lists the qualities each possesses. Also included is the analysis of the missing desirable qualities from both research designs
None of the excluded and included abstracts met all assessment criteria. While human teeth were used, the studies comprised in vitro conditions in that they were laboratory, not human studies. None used blinding. With these deficiencies, the validity of the evidence is decreased.
Discussion
The Acceptance score for the best case series is 57%. The acceptance score provides an evaluation of existing research relevant to the research question. By setting the level at 65%, acceptable research study designs are separated from unacceptable designs. At this time, the highest level of evidence is a randomized in vitro study.
The quality of the evidence for the best case series did not meet all the criteria in providing complete evidence to answer the research question. The reliability of the evidence was supported by randomization. The evidence, however, lacked sufficient validity. The major decrement in validity was the lack of in vivo conditions, using teeth in human subjects. Instead, the studies were carried out under in vitro, or laboratory, conditions. While the NaOCL test group acted as the control group, investigator blinding was not done, further decreasing validity. With Summary scores ranging from 60% to 65%, the abstracts of the best case series did not meet many of the criteria, for example, confidence intervals, power calculations, and using human subjects.
On a scale from poor (69% and below) to excellent (90% and above), the best case series suggests that the best available evidence is poor. While poor, the evidence is the best available evidence at this time in answering the research question for the subsequent systematic review.
Conclusion
The randomized, in vitro study design renders the best evidence in answering the research question. The Acceptance score for available best evidence at this time is 57%. This score suggests that the available evidence is poor. Therefore, the evidence may not be sufficient in conducting a systematic review whose results will have relevance in current clinical practice. More research is needed to update and improve the Acceptance score to reflect new evidence in answering like research questions: "Will 5.25% sodium hypochlorite compared to 2% chlorhexidine gluconate reduce E. faecalis counts in the root canal space?" Future research requires the use of in vivo study designs.
References
Ferguson, D.B., Marley, J.T., Hartwell, G.R., (2003). The effect of chlorhexidine gluconate as an endodontic irrigant on the apical seal: long-term results. Journal of Endodontics. 29(2), 91-94.
Jeansonne M. J., White R. R., (1994). A Comparison of 2.0% Chlorhexidine Gluconate and 5.25% Sodium Hypochlorite as Antimicrobial Endodontic Irrigants
Journal of Endodontics. 20(6), 276-278.
Niu, W., Yoshioka, T., Kobayashi, C., Suda, H., (2002). A scanning electron microscopic study of dentinal erosion by final irrigation with EDTA and NaOCl solutions. International Endodontic Journal. 35(11), 934-939.
Oncag, O., Hosgor M., Hilmioglu., S, Zekioglu., O., Eronat C., (2003). Comparison of antibacterial and toxic effects of various root canal irrigants. Interational Endodondic Journal. 36(6), 423-432.
Shabahang, S.,Torabinejad M., (2003) Effect of MTAD on Enterococcus faecalis-contaminated root canals of extracted human teeth. Journal of Endodontics. 29(9), 576-579.
Sirtes G, Waltimo T, Schaetzle M, Zehnder M., (2005) The effects of temperature on sodium hypochlorite short-term stability, pulp dissolution capacity, and antimicrobial efficacy. Journal of Endodontics, 31(9), 669-71.
Tanomaru, F. M., Leonardo, M.R., Silva, L.A., Anibal, F.F., Faccioli, L.H., (2002) Inflammatory response to different endodontic irrigating solutions. International Endodontic Journal, 35(9), 735-739.
Timmer, A., Sutherland, L.R., Hilsden, R.J. (2003). Development and evaluation of a
quality score for abstracts. BMC Med Res Methodol.
Weber, C. D., McClanahan, S.B., Miller, G. A., Diener-West, M., Johnson, J. D., (2003). The Effect of Passive Ultrasonic Activation of 2% Chlorhexidine or 5.25% Sodium Hypochlorite Irrigant on Residual Antimicrobial Activity in Root Canals. Journal of Endodontics. 29(9), 562-564.
Yamashita, J.C., Tanomaru F.M., Leonardo, M.R., Rossi, M.A., (2003). Scanning electron microscopic study of the cleaning ability of chlorhexidine as a root-canal irrigant. International Endodontic Journal. 36(6), 391-394.