

Authors: Abhishek D. Garg * and R. V. Hippargi **
Institution: * G. H. Raisoni National College, Pt. Ravishankar Shukla University, ** Institute of Science, RTM Nagpur University
Date: January 2008
ABSTRACT
The African elephants (Loxodonta africana), Asian elephants (Elephas maximus) and Woolly Mammoths (Mammuthus primigenius) diverged approximately 4-6 million years ago. The exact relationship amongst them has always remained controversial. Morphological studies have suggested a Mammuthus-Elephas clade while several others have supported Loxodonta-Mammuthus clade. Recently, phylogenetic trees based on mitochondrial DNA (mtDNA) and nuclear DNA sequences of respective elephants, also refuted each other. This has left the phylogenetic relationship between these elephants, unresolved. Present research was carried out in order to resolve this phylogeny and contribute towards further understanding of Elephantidae evolution. In the present investigation we attempted to resolve this phylogenetic relationship using a series of novel in silico methods and techniques. Initially, phylogenetic trees showing relationship between these three elephants (with Dugong dugon sequences serving as outgroups), were constructed via two methods (i.e. BIO-neighbor joining or BIO-NJ and Maximum parsimony or MP methods available in software, PHYLIP v.3.6a3) on the basis of mtDNA gene's and protein product's sequences. Results thus obtained were found to be unbiased such that phylogenetic trees supporting both types of clades were retrieved. To solve this problem we employed the approach of in silico restriction mapping of mtDNA as "tie-breaker" to select the correct set of phylogenetic trees. These restriction maps were built using the approach of Ferris et al. (1981) through the online software, Webcutter v.2.0. Restriction-map elucidated that Loxodonta and Mammuthus had 20.65% restriction sites in common, as compared to only 1.85% common sites between Elephas and Mammuthus. This analysis led us to conclusion that African elephant was a closer relative of Woolly Mammoth and not Asian Elephant. This result has important implications as it further resolves the Elephantidae phylogeny. Apart from that, the above results also increase the already existing rift between evolutionary trees made from fossil records and those made off molecular sequences. Such phylogenetic analysis has important implications in future for solving complex evolutionary relationships of species as well as in assisting the phylo-geographical studies of different species.
INTRODUCTION
The oldest proboscideans evolved in the lower Eocene period (Mahboubi et al. 1984), which was followed up by evolution of a considerable number of unusual elephants. However, out of all the proboscideans of past, Woolly Mammoth (Mammuthus primigenius) and Mastodons are most famous. Today, African elephants (Loxodonta africana) and Asian elephants (Elephas maximus) are the only proboscideans alive. Mammuthus, Elephas and Loxodonta are closely related to each other. It has been hypothesized that they evolved from the genus Primelephas in the African Pliocene (Maglio 1973; Valente 1983; Lowenstein et al. 1981), while Loxodonta and Elephas diverged from their common ancestors around the Miocene-Pliocene periods (Yang et al. 1996). Between 4 and 6 million years ago, the earliest representatives of Loxodonta, Elephas and Mammuthus appeared, as implied by south-eastern African fossil deposits (Maglio 1973; Kalb and Mebrate 1993). The last representative of Woolly Mammoths became extinct around 3.7 thousand years ago (Lister and Bahn 2000).
Paleontological analysis of skeletal and dental structures of these elephants has implied a closer relationship between Elephas and Mammuthus, supporting an Elephas-Mammuthus clade (Tassy and Shoshani 1988). However, authenticity of paleontology-based trees can be challenged because the fossil records on which they depend frequently have numerous gaps (George 1960). It has been observed that organisms tend to arise in the fossil records abruptly, being generally well equipped with the necessary characters for their particular habitats (Thomson 1988). Thus, a major problem associated with fossil records is the absence of fossils of transition forms. Subsequently, morphological comparisons involving Trunk-tip examinations have refuted paleontological theories and have supported Loxodonta-Mammuthus clade (Shoshani et al. 1998). However, immunological and hair-structure comparisons have provided conflicting results thereby leaving the problem unsolved (Shoshani et al. 1998; Valente 1983). With the sequencing of the full mitochondrial-DNA (mtDNA) of the mammoth, researchers thought that this long-standing debate would finally come to an end. Phylogenetic analysis involving almost complete mtDNA sequences of Loxodonta, Elephas and Mammuthus was found to support the Elephas-Mammuthus clade. This was soon refuted when analysis of nuclear DNA of the mammoth gave support to the Loxodonta-Mammuthus clade (Gibbons 2005). Analysis of 13 million base pairs of the Woolly Mammoth nuclear DNA implied an identity of 98.55% between Loxodonta and Mammuthus (Poinar et al. 2006). Thus, the debate on exact phylogenetic relationship between these elephants still remains unsolved. In this paper, we have analysed the phylogenetic relationship between these elephants in a bid to solve this problem and resolve the evolutionary relationship between them.
MATERIALS & METHODS
a) Sequence retrieval from databases
Sequences of mitochondrial genomes, mitochondrial rRNA and mitochondrial proteins of Loxodonta africana (Hauf et al. 2000), Elephas maximus (Rogaev et al. 2006), Mammuthus primigenius (Krause et al. 2006) and Dugong dugon (Arnason et al. 2002) were accessed from Entrez Genome (available at http://www.ncbi.nlm.nih.gov/entrez/) using the NCBI Sequence Viewer version 2. NCBI or SwissProt accession numbers of mtDNA and mitochondrial proteins of respective animals are enlisted in the Table 1.

Table 1. NCBI or SwissProt Accession Numbers of mtDNA and mitochondrial proteins of Loxodonta africana, Elephas maximus, Mammuthus primigenius and Dugong dugon.
b) Phylogenetic analysis of mtDNA, proteins & rRNA
Sequences of mtDNA, 12S rRNA, 16S rRNA, ATP synthase subunit 6, ATP synthase subunit 8, cytochrome b, cytochrome oxidase (cox) subunit I, cox II, cox III, NADH dehydrogenase (nad) subunit 2, nad 3, nad 4, nad 4L, nad 5 and nad 6 of Loxodonta, Elephas, Mammuthus and Dugong were separately aligned using ClustalW package (Higgins et al. 1996) which are assessable at www.ebi.ac.uk/clustalw/index.html. Phylogenetic analysis was performed using the Bio-Neighbour joining i.e. BIONJ (Gascuel 1997) and Maximum Parsimony (MP) methods (Li and Graur 1991) available in the phylogenetic analysis package PHYLIP version 3.6a3 (Felsenstein 1989) available at http://bioweb.pasteur.fr/seqanal/phylogeny/phylip-uk.html.
BIONJ analysis was performed using the program's dnadist' for nucleic acids and protdist' for proteins, while MP analysis was performed using the program's dnapars' for nucleic acids and protpars' for proteins (Felsenstein 1996). Jones-Taylor-Thornton matrix (Jones et al. 1992) was employed as a distance model in the case of proteins and a Jukes-Cantor matrix (Jukes and Cantor 1969) was used as a distance model in the case of nucleic acids. Bootstrap analysis was done with 3 random number seeds and 1000 replicates. Sequences of Dugong were used as outgroups in all the phylogenetic trees. The remaining parameters were set to default. Consensus phylogenetic trees showing node values were obtained using the Consensus Tree Program version 3.6a3 available in the PHYLIP package. These consensus trees were further used for plotting phylogenetic trees (Phylograms) using the program TreeView version 1.6.6 (Page 1996) assessed from http://taxonomy.zoology.gla.ac.uk/rod/treeview.html.
c) Restriction mapping of mitochondrial genomes
Restriction endonuclease digestion pattern or restriction maps of mitochondrial DNA (mtDNA) sequences of Loxodonta, Elephas and Mammuthus were constructed using the software package Webcutter version 2.0, which was assessed at http://rna.lundberg.gu.se/cutter2/ (Maarek et al. 1997). Whole mtDNA sequences of the three elephants were provided in RAW format as input for Webcutter. The sequences were treated as linear sequences and digested with 19 different restriction endonuclease enzymes, in accordance to the Ferris et al. (1981) approach. Ferris et al. had used 19 restriction enzymes (See Table 2.) for construction of restriction maps of human, chimpanzee, gorilla, orangutan and gibbon mtDNA sequences. The 19 restriction enzymes used for this investigation were the same as used by Ferris et al. (1981) with just one change - the FnuDII enzyme (Recognition sequence: CGCG) was replaced by FauNDI (Recognition sequence: CATATG) due to unavailability of FnuDII in Webcutter. Webcutter 2.0 accesses restriction enzymes from Restriction Enzyme Database or REBASE available at http://rebase.neb.com. Restriction mapping of mtDNA for each of the three elephants were done separately. The output was obtained in three forms: 1) Graphic map, 2) Table by enzyme name, and 3) Table by site position. The output from the "table by site position" was used for manually building an alignment of cleavage sites on mtDNA of respective elephants such that particulars of all cleavage sites were sequentially placed one after another, starting from the first nucleotide base pair of respective mtDNA up to the last base pair.

Table 2. List of 19 enzymes used in Restriction Mapping (modified from Ferris et al. 1981).
d) Calculations of sequence divergence from restriction map comparison
Calculations of sequence divergence from restriction map comparison were done using the Brown et al. (1979) approach. In this approach, S was considered to be a fraction of shared cleavage sites between two species, Z the number of sites shared between two species, X the number of cleavage sites in one species, and Y the number of cleavage sites in another species. The total number of sites compared is given by X + Y Z. Thus the fraction of shared or common cleavage sites (S) is given by the equation quoted in Figure 1. The equation, 1 S, is the fraction of unshared cleavage sites as well as the minimum number of base substitutions per site compared. S and 1 S aid in estimating the sequence divergence.

Figure 1. An equation quoting the expression for "S".
RESULTS
Present phylogenetic analysis identified either Asian or African elephant as closer relative of Mammoth depending upon the type of macromolecular phylogeny taken into consideration (See Table 3). Different macromolecules gave different types of phylogenies. Phylogenies involving nucleic acids (e.g. mtDNA, 12S rRNA and 16S rRNA) unanimously supported the Elephas-Mammuthus clade (See Figure 2) which was in line with the work of earlier researchers.
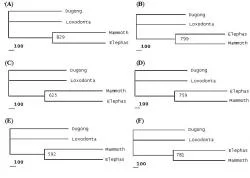
Figure 2. Phylogenies based upon nucleotide sequences of mtDNA and genes encoding for 12S rRNA and 16S rRNA. Following phylogenetic trees have been depicted above; Mitochondrial DNA phylogenies showing MP tree (A) and BIO-NJ tree (B). 12S rRNA gene phylogenies showing MP tree (C) and BIO-NJ tree (D). 16S rRNA gene phylogenies showing MP tree (E) and BIO-NJ tree (F).

Table 3. Clades implied by phylogenies of various macromolecules encoded by mtDNA of respective animals constructed by either BIO-Neigbour joining (NJ) or maximum parsimony method (MP) with their respective Bootstrap values.
Phylogenies built using proteins gave variable results. Protein phylogenies involving the amino acid sequences of cytochrome oxidase I, NADH subunit 2, NADH subunit 6 and ATP synthase subunit 6 supported the Elephas-Mammuthus clade (See Figure 3) while protein phylogenies involving NADH subunit 3, NADH subunit 4, NADH subunit 4L, NADH subunit 5 and NADH subunit 6 supported the Loxodonta-Mammuthus clade (See Figure 4). Protein phylogenies based on sequences of ATP synthase 8 and cytochrome b were considered faulty since they supported a Loxodonta-Elephas clade.

Figure 3. Phylogenies based upon Protein Sequences, which support Elephas-Mammuthus clade. Following phylogenetic trees have been depicted above; NADH subunit 2 phylogenies showing MP tree (A) and BIO-NJ tree (B). NADH subunit 6 phylogenies showing MP tree (C) and BIO-NJ tree (D). ATP subunit 6 phylogenies showing MP tree (E) and BIO-NJ tree (F). Cytochrome Oxidase subunit I phylogenies showing MP tree (G) and BIO-NJ tree (H).
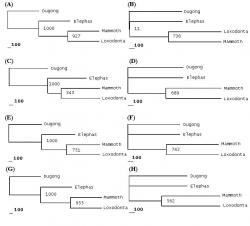
Figure 4. Phylogenies based upon Protein Sequences, which support Loxodonta-Mammuthus clade. Following phylogenetic trees have been depicted below; NADH subunit 3 phylogenies showing MP tree (A) and BIO_NJ tree (B). NADH subunit 4 phylogenies showing MP tree (C) and BIO-NJ tree (D). NADH subunit 4L phylogenies shoeing MP tree (E) and BIO-NJ tree (F). NADH subunit 5 phylogenies showing MP tree (G) and BIO-NJ tree (H).
On the other hand, protein phylogenies based upon sequences of cytochrome oxidase subunit II and cytochrome oxidase subunit III were not considered since their MP trees contradicted with the BIO-NJ trees. All phylogenetic analysis methods have their own disadvantages hence at least two out of NJ, ML and MP should be used and trees for which both agree should be considered best (Mount 2005). Thus, phylogenetic relationship couldn't be resolved properly between these elephants since the phylogenies obtained were almost unbiased. While the numbers of trees supporting Elephas-Mammuthus clade were slightly more than those supporting the Loxodonta-Mammuthus clade, some had insignificant bootstrap values (less then 70%). In view of the fact that we had both types of phylogenetic trees viz., trees supporting Elephas-Mammuthus clade as well as those supporting Loxodonta-Mammuthus clade, a distinguishing test was required to help select for the most suitable group of phylogenetic trees. Endonuclease-mediated Restriction mapping of respective mtDNA sequences was therefore used.
In present investigation, we have a set of phylogenies out of which some support Loxodonta-Mammuthus clade while others support Elephas-Mammuthus clade. Restriction mapping may not give us a phylogenetic tree but it can give us an idea about the particular clade out of the two, which we should support. Mitochondrial DNA-based Restriction map's comparison between these elephants (See Figure 5) elucidated that there were 19 cleavage sites matching between Loxodonta and Mammuthus mtDNA sequences in comparison to only two cleavage sites which matched between Elephas and Mammuthus mtDNA sequences. Calculations of sequence divergence based upon the comparisons of the restriction maps of mtDNA of Loxodonta and Elephas with that of Mammuthus were also obtained (See Table 4). These also supported the Loxodonta-Mammuthus clade such that these two elephants had 20.65% fraction of sites in common compared to 1.85% in case of Elephas-Mammuthus clade.

Figure 5. Manual alignment of mtDNA Restriction maps of respective elephants. Each mtDNA restriction map consists of cleavage sites placed one below another in sequential manner, as digested by the 19 endonuclease enzymes, starting from the nucleotide number one. The matches between two species for identical restriction sites have been depicted by a line. As seen above, 19 restriction sites match between Loxodonta and Mammuthus while only two sites match between Elephas and Mammuthus.

Table 4. Quantitative Comparison of cleavage maps of mtDNA of Loxodonta Africana, Elephas maximus and Mammuthus primigeniu.
This leads us to the outcome that the African elephant (Loxodonta africana) is a closer relative of Woolly Mammoth (Mammuthus primigenius) than Asian Elephant (Elephas maximus).
DISCUSSION & CONCLUSION
Phylogenetic relationship between Loxodonta, Elephas and Mammuthus has been a matter of debate for a very long time. Our study, which was derived using novel bioinformatics tools indicated that African elephant was phylogenetically closer to Woolly mammoth in relationship, than Asian elephant. During our analysis, PHYLIP software package was used for phylogenetic analysis, which along with the PAUP, is the most widely used phylogenetic package (Swofford et al. 1996). BIO-NJ was used in place of general NJ method, since BIO-NJ is more advanced than general NJ (Gascuel 1997). Phylogenetic analysis of these elephants was done on the basis of their mtDNA, mitochondrial proteins and mitochondrial rRNA sequences separately, because comparing genetic phylogenies, protein phylogenies and rRNA phylogenies amongst themselves can increase importance of phylogenetic analysis (Snel et al. 1999). Moreover, since inter-specific gene coalescence always precedes taxonomic divergence, a single gene tree cannot be a true tree (Avise 1994), and hence multiple trees must be analysed for a significant result. During our phylogenetic investigation, the molecular clock hypothesis also wasn't assumed since it could be a mistake to assume that same sequence positions evolve at same rate in different organism's genomes (Doolittle 1999). Various studies have suggested that evolution of mtDNA sequences in elephants is inconsistent with molecular clock hypothesis (Thomas et al. 2000); in fact its evolution is faster than normal estimations according to some investigators (Thomas et al. 2000). However, even usage of molecular clock assumptions by other researchers hasn't solved the problem (Krause et al. 2006; Thomas et al. 2000). Macromolecular sequences of Dugong dugon belonging to order Sirenia were used as outgroups since order Sirenia is recognized to be closest to order Proboscidea (Fischer 1996). While our "gene-specific" approach of phylogenetic analysis was slightly different from the approaches used contemporarily yet, in light of literature review we expected that our initial phylogenetic analysis would give a biased result thereby pointing towards a particular set of relationship or clade.
However the results thus obtained were quiet surprising as well as fascinating. Fascinating, because it highlighted the importance of comparing "gene-specific" phylogenetic trees for each gene within a fully sequence mtDNA across different species to differentiate between rate of evolution of various regions of respective mtDNA within each specie (an exercise that is seldom practiced today) and surprising because, we didn't expected that there would be so much difference between rate of evolution and/or mutational change across various elephant's mtDNA. This unbiased set of result that we got once again pointed towards the fact that the "Molecular Clock Hypothesis" may not be applicable in each and every case. It would be worth mentioning here that, almost all previous researchers assumed the molecular clock hypothesis while analysing the elephantidae phylogeny. The challenge that now stood before us was that, how to decide as to which set of phylogenetic trees were correct, whether those which supported Elephas-Mammuthus clade (7 phylogenetic trees supported this clade) or the ones which supported Loxodonta-Mammuthus clade (5 supported this clade)? It was now apparent to us that we needed a sort of differentiator or "tie-breaker" methodology, which may assist us in selection of a genuine set of phylogenetic trees and thereby help us in identifying the correct relationship amongst the two. After much literature research we decided that the vintage methodology of "restriction-mapping" fits well with our need of a "tie-breaker" methodology. We thus decided that only that clade or relationship would be selected, which has the maximum number of restriction sites matching amongst the restriction maps of the respective mtDNA sequences.
Restriction mapping may be considered reliable for resolving such relationships because restriction enzymes can sometimes detect such nucleotide differences that are not even capable of producing amino acid substitutions like synonymous difference in codons (Strickberger 2000). Similarly, Ferris et al. (1981) have shown that evolutionary inferences drawn from cleavage map of mtDNA are more in their resolving power in comparison to those drawn from protein electrophoretic differences, protein immunology and nuclear DNA hybridization (Ferris et al. 1981). This restriction mapping methodology that we used gave us strong results biased towards the Loxodonta-Mammuthus clade. With a support of 5 molecular phylogenetic trees and 20.65% fraction of common restriction sites within their mtDNA's restriction maps, the Loxodonta-Mammuthus clade stood tall.
Another important question that required verification was that, whether phylogenetic analysis based upon solely mitochondrial DNA sequences should be considered conclusive enough over nuclear DNA sequences for representing a family tree. Probability of a gene tree supporting a species or a family tree may be calculated with respect to effective population size of that organism, given by the equation quoted in Figure 6. Where, "Nf "is the effective population size of the organism at the time of first speciation event and "T" is the time in generations between first and second speciation events (Nei 1987). In case of mtDNA, Nf will tend to the female effective population size of an organism. After calculations it was found that values of T and Nf which gave a probability of 0.95 for mtDNA tree being congruent with species tree, gave a probability value of only 0.62 for a single autosomal gene to be congruent with the same species tree (Moore 1995). Thus, we conclude that phylogenies based on mitochondrial DNA sequences tend to be more effective than those based upon nuclear DNA sequences.
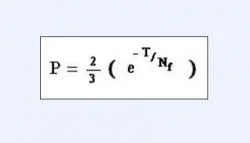
Figure 6. An equation quoting the expression for "Probability of a gene tree supporting a species or family tree".
All these results were good enough for us to conclude that Loxodonta africana shared clade with Mammuthus primigenius while Elephas maximus remained a comparatively distant relative. The phylogenetic analysis approach utilized by us (wherein we combined the "gene-specific" phylogenetic analysis with in silico restriction mapping) in the above investigation is unique and hasn't been utilized by anybody else before. Such phylogenetics approach has important implications in identifying the inconsistency of application of molecular clock hypothesis. It also may assist in getting a measure of rate of evolution and/or mutation across various regions of mtDNA of various species under study. In future, this approach of phylogenetic analysis may also be applied for resolving other such complex evolutionary relationships. Lastly, it may also find some application in analysis of phylo-geography and migration pattern of a particular set of species/sub-species across various regions/terrains.
REFERENCES
Arnason, U., J. A. Adegoke, K. Bodin et al. (2002) Mammalian mitogenomic relationships and the root of the eutherian tree. Proceedings of the National Academy of Sciences of USA 99, 8151-8156.
Avise, J. C. (1994) Molecular Markers, natural history and evolution. Chapman & Hall, New York.
Brown, W. M., M. George Jr. and A. C. Wilson (1979) Rapid evolution of animal mitochondrial DNA. Proceedings of the National Academy of Sciences of USA 76, 1967-1971.
Doolittle, W. F. (1999) Phylogenetic classification and the universal tree. Science 284, 2124-2128.
Felsenstein, J. (1996) Inferring phylogeny from protein sequences by parsimony, distance and likelihood methods. Methods in Enzymology 266, 368-382.
Felsenstein, J. (1989) PHYLIP: Phylogeny inference package (version 3.2). Cladistics 5, 164-166.
Ferris, S. D., A. C. Wilson and W. M. Brown (1981) Evolutionary tree for apes and humans based on cleavage maps of mitochondrial DNA. Proceedings of the National Academy Sciences of USA 78, 2432-2436.
Fischer, M. S. (1996) On the position of Proboscidea in the phylogenetic system of Eutheria: A systematic review. In The Proboscidea: Evolution and palaeoecology of elephants and their relatives (eds. Shoshani, J. and Tassy, P.), Oxford Univ. Press, UK, pp. 35-38.
Gascuel, O. (1997) BIONJ: an improved version of the NJ algorithm based on a simple model of sequence data. Molecular Biology & Evolution 14, 685-695.
George, T. N. (Jan 1960) Fossils in evolutionary perspective. Science Progress 48, 1-3.
Gibbons, A. (2005) New Methods yield mammoth samples. Science 310, 1889.
Hauf, J., P. J. Waddell, N. Chalwatzis et al. (2000) The complete mitochondrial genome sequence of the African elephant (Loxodonta africana), phylogenetic relationships of Proboscidea to other mammals and D-loop heteroplasmy. Zoology 102, 184-195.
Higgins, D. G., J. D. Thompson and T. J. Gibson (1996) Using CLUSTAL for msas. Methods in Enzymology 266, 383-382.
Jones D. T., W. R. Taylor and J. M. Thornton (1992) The rapid generation of mutation data matrices from protein sequences. Computer Applications in Biosciences 8, 275-282.
Jukes, T. H. and C. R. Cantor (1969) Evolution of protein molecules. In Mammalian protein metabolism (ed. Munro, H. N.), Academic Press, New York, pp. 121-132.
Kalb, J. E. and A. Mebrate (1993) Fossil elephantoids from the hominid-bearing Awash Group, Middle Awash Valley, Afar Depression, Ethiopia. Transactions of American Philosophical Society 83, 1-114.
Krause, J., P. H. Dear, J. L. Pollack et al. (2006) Multiplex amplification of the mammoth mitochondrial genome and the evolution of Elephantidae. Nature 439, 673-676.
Li, W. H. and D. Graur (1991) Fundamentals of molecular evolution, Sinauer Associates, Sunderland.
Lister, A. and P. Bahn (2000) Mammoths: Giants of the ice age, Marshall Editions, London.
Lowenstein, J. M., V. M. Sarich and B. J. Richardson (1981) Albumin systematics of the extinct mammoth and Tasmanian wolf. Nature 291, 409411.
Maarek, Y., I. Shaul et al. (1997) Webcutter: A System for dynamic and tailorable site mapping. Computer Networking & ISDN Systems 29, 1269-1279.
Maglio, V. J. (1973) Origin and evolution of the Elephantidae. Transactions of American Philosophical Society 62, 1-149.
Mahboubi, M., R. Ameur, J. Y. Crochet and J. J. Jaeger (1984) Earliest known proboscidean from early Eocene of north-west Africa. Nature 308, 543-544.
Moore, W. S. (1995) Inferring phylogenies from mtDNA variation: Mitochondrial-gene tree versus nuclear-gene trees. Evolution 49, 718-726.
Mount, D. W. (2005) Bioinformatics: Sequence and Genome Analysis, 2nd Ed., CBS Publishers & Distributors, New Delhi.
Nei, M. (1987) Molecular evolutionary genetics, Columbia University Press, New York.
Page, R. D. M. (1996) TREEVIEW: An application to display phylogenetic trees on personal computers. Computer Applications in Biosciences 12, 357-358.
Poinar, H. N., C. Schwarz et al. (2006) Metagenomics to paleogenomics: Large-scale sequencing of mammoth DNA. Science 311, 392-394.
Rogaev, E. I., Y. K. Moliaka, B. A. Malyarchuk et al. (2006) Complete Mitochondrial Genome and Phylogeny of Pleistocene Mammoth Mammuthus primigenius. PLoS Biology 4, e73.
Shoshani, J., E. M. Golenberg and H. Yang (1998) Elephantidae phylogeny: Morphological versus molecular results. Acta Theriologia (Suppl. 5) 89-122.
Snel, B., P. Bork and M. A. Huymen (1999) Genome phylogeny based on gene content. Nature Genetics 21, 108-110.
Strickberger, M. W. (2000) Evolution, 3rd Ed., Jones & Bartlett Publication, Sundbury.
Swofford, D. L., G. J. Olsen and P. J. Waddell (1996) Phylogenetic inference. In Molecular systematics, 2nd Ed. (eds. Hillis, D. M. et al.), Sinauer Associates, Sunderland, pp. 407-514.
Tassy, P. and J. Shoshani (1988) The Tethytheria: elephants and their relatives. In The phylogeny and classification of tetrapods. II. Mammals (ed. Benton, M. J.), Clarendon, Oxford, UK, pp. 283-315.
Thomas, M. G., E. Hagelberg, H. B. Jone et al. (2000) Molecular and morphological evidence on the phylogeny of the Elephantidae. Proceedings of the Royal Society of London B 267, 24932500.
Thomson, K. S. (1988) Morphogenesis and Evolution, Oxford University Press, Oxford.
Valente, A. (1983) Hair structure of the wooly mammoth, Mammuthus primigenius and the modern elephants, Elephas maximus and Loxodonta africana. Journal of Zoology London 199, 271-274.
Yang, H., E. M. Golenberg and J. Shoshani (1996) Phylogenetic resolution within Elephantidae using fossil DNA sequence from the American mastodon (Mammut americanum) as an outgroup. Proceedings of the National Academy of Sciences of USA 93, 1190-1194.