

Author: Katherine A. Dunning, Marcia Kyle, and Yang Kuang
Institution: Arizona State University
Date: December 2008
Abstract
Many factors affect population dynamics in Daphnia, including the quantity and quality of the algae upon which they feed. A previous study by Urabe and colleagues examined the effects of light and nutrient supply on stoichiometric food quality and showed that, while increased light intensity stimulated increased algae growth, the algae became phosphorus-limited and thus of poor quality due to higher C:P ratios. Furthermore, Urabe's study showed that, under low light, one Daphnia species outcompeted the other, but under high light the two species coexisted. We further investigated the effects of light intensity on Daphnia dynamics and inter-specific interactions by considering individual size, species composition, and algal C:P ratios in small jars with two species of Daphnia alone or in competition. Our goal was to obtain detailed results amenable to mathematical modeling of effects of light intensity on Daphnia. Our data show clear effects of light intensity on algal abundance and C:P ratio, on Daphnia population size, and on the relative success of the two species. However, data do not show coexistence as was observed in the previous study. Data from the experiment were then used to parameterize a stoichiometrically explicit version of the classic Lotka-Volterra equations to further explore dynamical effects of light intensity. Our analysis suggests that parameters taken from the literature may not correctly represent the true values under experimental conditions.
Introduction
It can be argued that the science of ecology has had two main, and largely disconnected, themes: the study of population dynamics and interactions (population and community ecology) and the study of the flows of energy and materials (ecosystem ecology) (Hagen 1992). For example, predator-prey interactions have been the subject of sustained study in ecology since Elton (1927) while studies of competitive interactions between species also have a long history (Connell 1961). During the post-World War II era, studies of biogeochemical cycling (Whitaker et al. 1979, Likens et al. 1977) in ecosystems and energy flow in food webs (Odum 1971) have increased in prominence. However, connections between these two realms of ecology are relatively weak (Sterner and Elser 2002).
Recently, developments within the emerging field of ecological stoichiometry have attempted to make a more explicit link between population dynamics and ecosystem processes. Ecological stoichiometry is the study of the balance of energy and multiple chemical elements in living systems (Sterner and Elser 2002), using classic laws of conservation of mass and definite proportions to explain a variety of ecological relationships. It is now known that organisms have different life histories that lead to different nutrient requirements and that these metabolic demands in consumers must be met from their food source (Sterner and Elser 2000). If the food source is too low in a significant nutrient, the consumer may be unable to achieve maximal growth and reproduction. Since various consumers likely have distinct nutritional responses even to the same food source, the nutrient content of the food can have a significant impact on the outcome of ecological interactions between the consumers, such as competition for food (Sterner and Elser 2002).
Many experiments have been conducted to test these interactions and generally show that, while increased light increases primary productivity that can be consumed by herbivores, it also produces primary producer biomass with high carbon:nutrient ratios that may be nutritionally unsuitable (Sterner et al. 1997, Diehl 2002). For example, Hessen et al. (2002) performed detailed laboratory assays to analyze the relationship between light and nutrient availability and Daphnia growth. They determined that increasing light or decreasing available phosphorus would both decrease food quality and decrease Daphnia growth rates. Urabe et al. (2002) and Hall (2004) investigated Daphnia's response to various light and nutrient gradients in lake settings and found that P-rich Daphnia dominated grazer assemblages under high nutrient conditions, but were out-competed by grazers more tolerant of higher food C:P ratios under poor nutrient conditions. These studies indicate that varying light can profoundly affect food quality by affecting algal growth to either dilute available nutrients within the Daphnia food source or limit algal growth and thereby maintain higher nutrient concentrations and , thus, high food quality. Further, they show that this regulation can significantly affect consumer performance and even competitive dynamics. Competitive interactions were a focus of Urabe et al. (2002) who investigated the effects of light intensity on coexistence of two species of Daphnia. They showed that increased light intensity increased algal productivity and biomass but also lead to higher C:P ratios in the algae. Additionally, under high light conditions the competitive interactions between the Daphniawere dampened due to the unfavorable food quality and both species were able to coexist. However, in low light treatments the more competitively superior Daphnia species was able to dominate. Consistent with these patterns, they showed that under low light Daphnia fecundity declined with increasing Daphnia biomass but this relationship was reversed under high light conditions (i.e. individual fecundity increased with increasing Daphnia biomass). This is most likely a result of facilitation among the zooplankton in which, at high light levels with poor food quality, high zooplankton populations were able to graze down the algal biomass while recycling limiting P, thus increasing per capita P supply to the algae and lowering its C:P ratio.
These results provide strong evidence that changes in ecosystem conditions can alter both population dynamics and the nature of inter-specific interactions via stoichiometric mechanisms. However, Urabe and colleagues did not collect sufficiently detailed data on algae and zooplankton dynamics and demography to fully resolve the mechanisms by which the effects of light intensity were produced. Available data are also generally insufficiently detailed and temporally resolved to explicitly model the interactions using tools of theoretical community ecology. To address this, we performed a similar experiment to examine the effects of light intensity on competition in greater detail. The test subjects included a daphnid species native to North America (D. pulicaria) and a second species native to Africa that has become a common invader across North America (D. lumholtzi). Two stoichiometrically explicit mathematical models based on Loladze et al. (2000, 2004) were analyzed for comparison against the experimental results. The Loladze et al. models were selected because they describe energy flow through different trophic levels, focus on phosphorus as a key nutrient, and were designed based on previous studies using algae and zooplankton.
Methods
We used the chlorophyte alga, Scenedesmus obliquus, as a food source and two species of Daphnia, D. pulex and D. lumholtzi, in 3-L microcosms in an indoor laboratory setting with regulated light and temperature exposure. D. pulex was selected because of its high requirement for phosphorus. D. lumholtzi provided a suitable competitor because it is easy to visually identify from D. pulex, has a greater tolerance of poor nutrient (i.e. high C:P) food conditions, and is a common invader in North America. We imposed two light conditions with the same initial nutrient concentrations. Target light intensities for each treatment were chosen from based on previous research (Urabe and Sterner 1996). High light conditions were achieved through the use of multiple fluorescent lights to reach an average intensity of 218 uE/m2/s at the upper surface of the microcosms while low light jars were shaded using screening that blocked 90% of light, giving low light treatments an average light intensity of 21.8 uE/m2/s. All lights were set on a timer to produce a daily cycle of 16 h of light and 8 h of darkness. Temperature ranges were documented throughout the experiment with an average of 25.6oC. In order to counteract any discrepancy in temperature or actual light intensity across the setup, the jars were moved to random positions after every sampling cycle.
Each jar was filled with 3 L of zooplankton COMBO medium (Kilham 1998) with an N:P ratio of 74.5. Nutrient-replete algae from a chemostat were inoculated into each jar at a target concentration of 1 mg C/L and allowed to grow under high light or low light conditions for two weeks before the introduction of zooplankton. Each light treatment included four additional zooplankton treatments (n=3): a control lacking zooplankton, D. pulex or D. lumholtzimonocultures, and D. pulex and D. lumholtzi together in competition. Each jar began with a population of 10 individuals. In competition treatments, five individuals of each species were added. These individuals were chosen randomly from a large population of neonates that were less than 12 hours old. All microcosms were well-stirred twice each day to keep the algae in suspension.
Twice each week, the total populations of zooplankton in each jar were completely enumerated. Populations were then non-destructively sub-sampled for determination of body size and fecundity. To do this, a representative sample of the population was removed from each jar and then each individual was photographed under a dissecting microscope (25 X or 40 X magnification), and then returned alive to its microcosm. Our previous experience indicates that this procedure imposes minimal mortality on the animals (>90% survivorship). Image analysis software was later used to determine Daphnia size and fecundity throughout the experiment. Each week, 250 mL of the suspension was replaced with fresh media and the removed suspension was filtered onto pre-combusted glass filters (Whatman GF/F) that were frozen for later analysis of carbon and phosphorus. This process continued for six weeks. Simultaneous analysis of carbon and phosphorus was performed on the frozen filters using an EGM-4 infrared gas analyzer (PP Systems) and colorimetry (American Public Health Association 1998) following the method of Lampman and Caraco (2001).
Mathematical Model
We analyzed single-prey and two-prey predator-prey models modified to meet key stoichiometric assumptions following Loladze et al. (2000) and Loladze et al. (2004). The latter was used for direct data fitting and simulations, while the former was primarily used for mathematical analysis. Both are stoichiometrically explicit renditions of the classic Lotka-Volterra system of population equations (Lotka 1925). The single species model simply considers a single predator (herbivore, y) consuming a single prey (producer, x).

This model describes the change in primary producer density as the difference between its resource-dependent growth and its consumption by the grazer. Producer growth is modeled as a reduction in the intrinsic maximum growth rate (b) reduced by either a light-induced limit on carrying capacity (K) or a Droop-type internal quota of limiting nutrient (in this case, P). Consumption is modeled as a Holling type II functional response (Loladze et al. 2000). The change in herbivore density is modeled as the difference in food-dependent growth less their natural death. Growth from consuming the producer is modeled on the basis of the grazer's efficiency in converting the ingested producer biomass into their own biomass (e), which is reduced by stoichiometric food quality when the producer's biomass P:C ratio is lower than the consumer's (s). Hereafter this model will be referred to as the LKE-1 model.
The two-predator competition model expands upon this initial system of equations to include a second consumer species. This model is very similar to the single predator model and simply adds a similar equation for the second consumer and considers the needs of both within all three equations. This simple addition adds complexity to the system and allows for mathematical analysis of inter-specific interactions between the consumer taxa. Hereafter this model will be referred to as the LKE-2 model.

We further adjusted the LKE-2 model to account for internal loss of phosphorus to detritus. The original formulation assumes that the total phosphorus in the system is entirely contained in either the consumers or the producer. In reality, this is unlikely. Rather, some phosphorus sinks to the bottom in detritus. This additional phosphorus loss (p) is captured as the combined phosphorus content of dead Daphnia and unassimilated phosphorus that is not recycled back to the food source. The timescale of the experiment ensures that no remineralization of such detritus occurs.

Parameter Estimation
Mathematical analysis was performed using Matlab software with the LKE-1 model equations. Whenever possible, key parameters were estimated directly from experimental data. Parameters that could not be obtained directly were obtained from published literature. Simulation results were then compared to experimental results for analysis. The light-induced carrying capacity, K, and the producer growth rate, r, were determined using the least-squares method in Matlab based on experimental data from the time series of algal biomass growing without Daphnia and from algal dynamics in sample jars where all Daphniahad gone extinct. Using jars without Daphnia allowed us to make these estimates for algal parameters without the influence of Daphnia in the system. The minimum cell P:C quota for the producer, q, was determined by finding the inverse of the highest observed algal C:P under high light intensity. The total phosphorus in the system (TP) was calculated by summing the initial P contributed by the algae and the media. The phosphorus values were found using the colorimetry techniques described previously. The remaining parameters were estimated from the published literature of Daphnia parameters (Table 1).

Table 1. Parameter values based on experimental data and published values. Loss rate is not well defined within the literature and was assigned a small value. The 1st consumer is modeled as Daphnia pulex while the 2nd consumer represents Daphnia lumholtzi.
Experimental Results
Algae
Algal biomass increased throughout the duration of the experiment, reaching higher levels in high light conditions (Figure 1).

Figure 1. Time series of algal carbon concentration comparing high light and low light treatments. High light treatments experienced much higher carbon concentrations than low light (P
Algal C:P ratios increased through the first half of the experiment before leveling off for the rest of the study period. This occurred during the same time period that the Daphniapopulations reached their highest abundances (Figure 2).
In all treatments, including low light, algal C:P was relatively high (>300). Overall, high light treatments had both higher carbon concentrations and higher C:P ratios than low light treatments, as expected (P < 0.0001).
The presence of Daphnia decreased both algal biomass and C:P ratio (Figure 3).

Figure 2. This figure shows the relationship between the increase in zooplankton population and the algal C:P in a) high light and b) low light treatments. Data for algal C:P was lost in week 5 due to chemical reagent contamination.

Figure 3. Comparison of the least squares means for a) algal C:P in each treatment, b) algal carbon concentration in each treatment, and c) algal phosphorus concentration in each treatment, with D1 being D. pulex and D2 being D. lumholtzi. ANOVA results for significant variables are indicated by their corresponding p-values (α=0.05).
Under low light conditions, there was no difference in algal C:P ratio in the one-species and the mixed-species treatments. However, under high light, algal C:P ratios were higher in the D. pulex treatment than in the D. lumholtzi or competition treatments, which did not differ from each other. Additionally, algae in high light D. pulex treatments had significantly lower biomass in terms of both carbon and phosphorus concentrations.
Daphnia
Zooplankton populations were higher in the high light treatments than in low light treatments (Figure 4). All Daphnia populations experienced a peak near the end of the experiment (weeks 4 or 5). D. lumholtzi populations behaved similarly under high light conditions in both the mixed and individual species treatments. Under low light conditions, D. lumholtzi experienced total extinction in all treatments. While D. pulexperformed well in the one-species high light treatment, D. pulex abundance was reduced to low levels in the two-species high light treatments. However, D. pulex fared much better under low light conditions and persisted in both individual and mixed treatments. The resulting error in the population values is due to the low number of observations (n=3). Increasing the number of observations would decrease this error, but would also increase the difficulty of the experiment.

Figure 4. Changes in Daphnia populations over the course of the experiment: a) D. lumholtzi alone b) D. lumholtzi in competition c) D. pulex alone d) D. pulex in competition.
Data Fitting Daphnia population dynamics were compared to mathematical predictions for up to 42 days, the duration of the experiment. However, since only neonates were initially added in the experiment and the model is based on a mixed age structure, only data a week into the experiment were considered. This allows the population being represented by the experimental data to be more similar to the model assumptions.
Simulations from the two-predator competition model were overestimates of the actual zooplankton biomass in low light treatments, but underestimated biomass in high light treatments (Figure 5). The low light simulations showed similar behavior to the observed data qualitatively, with D. pulexdominating D. lumholtzi. However, the model was unable to capture the quantitative experimental results and predicted higher than observed D. pulexpopulation densities. High light simulations predicted that both populations would suffer extinction. In reality, experimental results showed D. lumholtzi eliminated D. pulex. Changing some key parameter values greatly changed the results (Figure 6).

Figure 5. Comparison of observed Daphnia populations against simulated results for a) high light and b) low light conditions with D. pulex (black), D. lumholtzi (grey), and algae (dashed).

Figure 6. Comparison of observed Daphnia populations against simulated results with adjusted parameters for a) high light and b) low light conditions with D. pulex (black) and D. lumholtzi (grey).
The clearance rate and assimilation efficiency of the first consumer were both reduced from 1 to 0.8 and 0.7 to 0.5, respectively. For the second consumer, the clearance rate was decreased from 1 to 0.5, the assimilation efficiency was reduced from 0.7 to 0.4, and the death rate was increased from 0.02 to 0.04. With these new parameter values, the high light simulations remained unable to capture the experimental results. However, low light simulations showed much better predictions of the experimental results, with simulations closely tracking observed zooplankton biomass (Figure 6).
Boundary Equilibria
Using specific parameter values, we analyzed the boundary equilibria with a theorem from the single-predator LKE-1 model (Loladze et al. 2000). This theorem states that if the carrying capacity of the producer without the presence of grazers (k) lies between the two x-intercepts of the grazer's nullcline the region will have a saddle point, where k=min(K,TP/q). If k is not bounded by these intercepts, the region will be locally asymptotically stable (L.A.S.) and the consumer will move to extinction. We applied this theorem to each of four cases: high light & D. pulex alone, high light & D. lumholtzi alone, low light & D. pulex alone, and low light & D. lumholtzi alone (Table 2). For cases when the value of k is close to either one of the boundaries, the stability is very sensitive. However, the equilibria results did not differ across light treatments and did not appear to correspond with the differences between high light and low light conditions observed through the experiment. Instead, all the values for intercepts were the same for both light treatments of D. pulex and D. lumholtzi since literature parameters used in these calculations did not differ with light conditions. The only difference in values was the k value in high light and low light. Regardless, equilibria for both species under both light treatments were saddle points.
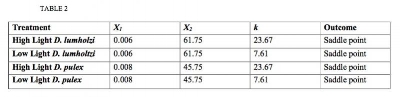
Table 2. Summary of the boundary equilibria results. A saddle point indicates that the population will persist in the given conditions. Locally asymptotically stable (L.A.S.) indicates that the population will be drawn to extinction.
Discussion and Conclusions
Consistent with previous work, increased light intensity resulted in higher algal C:P (Urabe and Sterner 1996, Urabe et al. 2002, Hall et al. 2004). However, in contrast to the results of Urabe et al. (2002), high light intensity did not promote coexistence between these two Daphnia species. Rather, D. pulex was excluded by D. lumholtzi in high light treatments while D. lumholtzi was completely eliminated in low light treatments (Fig. 4). Their poor performance in all low light may be due to differences in threshold food concentrations (TFC). It has been shown in previous studies that D. lumholtzi has a TFC of 0.06,0.2 mg/l dry weight while D. pulex has a TFC of 0.01,0.02 (Sarma et al. 2005, Duncan 1989). Under low light conditions, D. pulex's lower TFC likely allowed it to survive despite the low food concentrations. However, D. lumholtzi has a higher TFC and was unable to cope with the lower algae concentrations associated with low light treatments. In the future, it would be interesting to further investigate D. lumholtzi's inability to persist under low light conditions. Another interesting observation was that the presence of D. pulex resulted in significantly higher algal C:P relative to D. lumholtzi treatments. This may be due to the fact that D. pulexhas a higher body P content than D. lumholtzi (Main et al. 1997) and thus may sequester more P in its biomass and thus depriving algae of P from the limited internal pool in the mesocosms.
The mathematical analysis complements the experimental results by providing a larger context to understand observed dynamics. Overlaying the observed data with the simulated data showed significant differences between simulated results and experimental data (Fig. 5). However, by adjusting parameters that were originally based on results in the literature, while still keeping them realistic, we were able to more closely match model output with observed results in low light conditions. The boundary equilibria assessed by the mathematical analysis did not reveal any differences across treatments and suggests that all boundary equilibria should be stable since they are saddle points. Stable boundary equilibria suggest an unstable coexistence steady state. This is supported by our experimental results. We observe that D. pulex is sensitive to competitive pressure in high light conditions as it was able to survive in monoculture, yet unable to coexist with D. lumholtzi in mixed cultures. Similarly, D. lumholtziwas sensitive to low light conditions and suffered extinction. This suggests that the model is capable of providing accurate results with different parameter value than are typically found in the literature. Thus, the model is adequate but using published parameter values is not. This is an important conclusion since it is very common for published parameter values to be used to validate theoretical models. Our results suggest that these parameters are extremely sensitive to the experimental conditions and may vary more than originally thought. Thus, when combining experimental results with mathematical analysis it is important to measure these parameters directly. Relying entirely on published values may not properly reflect the experimental conditions being studied and may lead to different mathematical results.
The original mathematical model makes several unrealistic assumptions. First, in LKE-1 the phosphorus in the system is defined to be entirely within either the algae or the Daphniathemselves (Loladze et al. 2000). This is unlikely to be true, given the time it takes for P in algae-derived detritus to be remineralized to produce P that is taken up by living algae. Therefore, there are actually three primary pools of phosphorus (viable algae, Daphnia, and detritus). Thus, our final model included a fourth equation to model the detrital pool. The models also assume that the P:C of the grazers remains constant, an assumption that increases the tractability of the equations. However, it has been demonstrated that this value may decline under poor food quality conditions and the grazers may not have strict homeostasis (DeMott et al. 1998) and that such modulation of consumer P:C ratio can have major effects on the outcome of stoichiometric models (Mulder and Bowden 2007). This may explain the model's underestimate of D. lumholtzi densities under high light conditions (Figure 6).
The simulated results also highlight difficulties in obtaining appropriate parameters from literature. Most mathematical models include multiple parameters that have significant effects on simulated outcomes. While some of these key parameters have been well studied and can easily be found in literature sources, they may not adequately reflect the true values under different experimental conditions. Instead, it is important to estimate parameters from data obtained under the experimental conditions. This may require preliminary experiments focusing on parameter estimation specifically.
There are also several points to improve upon in the experimental design. It was seen through the experimental results and confirmed through the mathematical analysis that the six-week period was too short to thoroughly characterize the population dynamics. Rather, the experiment should continue for a greater length of time in order to see a full period of potential population oscillations. In their experiment, Urabe et al (2002) continued their observations for 100 days. This would be a more appropriate time frame for future studies. It is also important to use a sampling method that can differentiate between living algal cells and detritus to determine algal biomass instead of simply filtering the suspended particles. Daphnia are filter feeders and are not able to efficiently separate algae from detritus. Thus, high levels of detritus may result in overestimate of algal biomass unless the sampling method can separate them. Finally, this experiment has shown how difficult even a seemingly simple ecological system can be to model mathematically. Additional studies focusing on modeling algae in a similar context would be useful as it is difficult to correctly simulate consumer growth if the simulations for the producer are not realistic.
Despite these difficulties, the qualitative agreement between the experimental data and certain mathematical simulations suggests even relatively simplistic stoichiometric models of species interactions may be useful in analyzing stoichiometric effects on zooplankton interactions. Although coexistence was not observed in this study as it was in previous work (Urabe et al. 2002), our analysis suggests this is highly dependent the relevant ecophysiological traits of the species involved. The Urabe experiment included two P-rich species of Daphnia while our study considered one P-rich species and a low-P species, a difference that may significantly affect the nature of the interactions between the two species under ecosystem P-limitation. Our study combines the mathematical suggestions of Loladze et al. (2000, 2004) and the Urabe experiment. While our results do not match those of the Urabe experiment, they do show that the models are capable of providing qualitative results that match experimental results and could be useful in further analysis of stoichiometric effects on Daphnia dynamics and competition.
References
Andersen, T., P.J. Faerovig, D.O. Hessen. 2007. Growth rate versus biomass accumulation: different roles of food quality and quantity for consumers. Limnol. Oceanogr. 52(5): 2128-2134
Brett, M.T., D.C. Muller-Navarra, S.K. Park. 2000. Empirical analysis of the effect of phosphorus limitation on algal food quality for freshwater zooplankton. Limnol. Oceanog. 45(7): 1564-1575.
Connell, J.H. 1961. The influence of interspecific competition and other factors on the distribution of the barnacle Chthamalus stellatus. Ecology 42(4): 710-723.
DeMott, W., Gulati, R., Siewertsen, K. 1998. Effects of phosphorus-deficient diets on the carbon and phosphorus balance of Daphnia magna. Limnol. Oceanog. 43: 1147-1161.
DeMott, W., Pape, B.J., Tessier, A.J. 2004. Patterns and sources of variation in Daphnia phosphorus content in nature. Aquat. Ecol. 38: 433-440.
Diehl, S., Berger, S., Ptacnik, R., Wild, A. 2002. Phytoplankton, light, and nutrients in a gradient of mixing depths: field experiments. Ecology. 83(2): 399-411.
Duncan, N. 1989. Food limitation and body size in the life cycle of planktonic rotifers and cladocerans. Hydrobiologia. 186/187: 11-28.
Elser, J. J. 2006. Biological stoichiometry: a chemical bridge between ecosystem ecology and evolutionary biology. The American Naturalist 168: S25-S35.
Elton, C.S. 1927. "Animal Ecology". Sidgwick and Jackson: London.
APHA. 1998. Standard method for the examination of water and wastewater. 20th ed. American Water Works Association, Water Environment Federation, Washington, D.C.
Hall, S.R., M.A. Leibold, D.A. Lytle, V.H. Smith. 2004. Stoichiometry and planktonic grazer composition over gradients of light, nutrients, and predation risk. Ecology 85(8): 2291-2301.
Hagen, Joel B. 1992. "An Entangled Bank: The Origins of Ecosystem Ecology". New Brunswick: Rutgers University Press.
Hessen, D.O., P.J. Færøvig, T. Andersen. 2002. Light, nutrients, and P:C ratios in algae: grazer performance related to food quality and quantity. Ecology 83(7): 1886-1898.
Kilham, S.S., Kreeger, D.A., Lynn, S.G, Goulden, C.E., Herrera, L. 1998. COMBO: a defined freshwater culture medium for algae and zooplankton. Hydrobiologia 377: 147-159.
Lampman, G.G., N.F. Caraco, J.J. Cole. 2001. A method for the measurement of particulate C and P on the same filtered sample. Mar. Ecol. Prog. Ser. 217: 59-65.
Likens, GE, FH Bormann, RJ Pierce, JS Eaton, NM Johnson. 1977.
"Biogeochemistry of a Forested Ecosystem." 1st ed. Springer-Verlag, New York.
Loladze, I., Y. Kuang, J.J. Elser. 2000. Stoichiometry in producer-grazer systems: linking energy flow with element cycling. Bulletin of Math. Bio 62: 1137-1162.
Loladze, I., Y. Kuang, J.J. Elser, W.F. Fagan. 2004. Competition and stoichiometry: coexistence of two predators on one prey. Theoretical Population Biology 65: 1-15.
Lotka, A. J. 1925. Elements of Physical Biology, Baltimore: Williams and Wilkins.
Reprinted as Elements of Mathematical Biology (1956) New York: Dover.
Main, T., D. R. Dobberfuhl, and J. J. Elser. 1997. N:P stoichiometry and ontogeny in crustacean zooplankton: a test of the growth rate hypothesis. Limnol. Oceanogr. 42: 1474-1478.
Mitra, A. 2006. A multi-nutrient model for the description of stoichiometric modulation of predation in micro- and mesozooplankton. Journal of Plankton Research 28(6): 597-611.
Mulder, K., W.B. Bowden. 2007. Organismal stoichiometry and the adaptive advantage of variable nutrient use and production efficiency in Daphnia. Ecological Modeling 202: 427-440.
Odum, E.P. 1971. "Fundamentals of Ecology". 3rd ed. W.B. Saunders Co.: Philadelphia, PA.
Sarma, S.S.S., S. Nandini, R.D. Gulati. 2005. Life history strategies of cladocerans: comparisons of tropical and temperate taxa. Hydrobiologia 542: 315-333.
Sterner, R.W., J.J. Elser, E.J. Fee, E.J. Guildford, T.H. Chrzanowski. 1997. The light:nutrient ratio in lakes: the balance of energy and materials affects ecosystem structure and process. Am. Nat. 150(6): 663-684.
Sterner, R.W. and J.J. Elser. 2002. "Ecological Stoichiometry: The Biology of Elements from Molecules to the Biosphere". Princeton University Press, Princeton, NJ.
Sterner, R.W. and D.O. Hessen. 1994. Algal nutrient limitation and the nutrition of aquatic herbivores. Annu. Rev. Ecol. Syst. 25: 1-29.
Urabe, J., R.W. Sterner. 1996. Regulation of herbivore growth by the balance of light and nutrients. PNAS 93(16): 8465-8469.
Urabe, J., M. Kyle, W. Makino, T. Yoshida, T. Andersen. 2002. Reduced light increases herbivore production due to stoichiometric effects of light/nutrient balance. Ecology 83(3): 619-0627.
Whitaker, R.H., G.E. Likens, F.H. Bormann, J.S. Eaton, T.G. Siccama. 1979. The Hubbard Brook ecosystem study: forest nutrient cycling and element behavior. Ecology 60(1): 203-220.