

Authors: Michael Zorniak and Katrina Brandis
Institution: Lake Forest College
Date: December 2007
ABSTRACT
Parkinson's disease is characterized by the progressive death of dopaminergic neurons in the human brain. The misfolding and aggregation of α-synuclein, as well as the presence of reactive oxygen species, are thought to contribute to this cellular toxicity. The mechanism of interaction between these two pathways is unknown. Mitochondrial dysfunction, specifically, incomplete respiratory metabolism and loss of antioxidant enzymes, has long been implicated as the culprit for oxidant accumulation.
Our lab has previously developed a budding yeast (Saccharomyces cerevisiae) model to study the genetic regulation of α-synuclein misfolding and toxicity. We evaluated the hypothesis that oxidative stress, mitochondrial dysfunction, and α-synuclein misfolding are combinatorial in producing cellular toxicity. , α-Synuclein was expressed in yeast that lacked either cytosolic or mitochondrial/peroxisomal catalase enzymes to determine whether increased oxidative stress enhances α-synuclein toxicity. We tested whether yeast lacking non-essential mitochondrial enzymes, mitochondrial glyoxylase II and α-ketoglutarate dehydrogenase, would increase α-synuclein misfolding, aggregation, and toxicity. Intracellular aggregates were observed in yeast lacking α-ketoglutarate dehydrogenase, yet cellular toxicity was not observed in all four yeast knockout strains. Formation of aggregates, however, was not due to higher levels of reactive oxygen species. Despite this aggregate phenotype, α-synuclein levels were diminished when compared to the isogenic parent strain. In a strain lacking mitochondrial manganese superoxide dismutase, toxicity was previously observed without α-synuclein aggregates, yet displayed enhanced oxidant accumulation upon further evaluation. Results from this study emphasize the unexpected complexity of interactions between α-synuclein, oxidative stress, and mitochondrial dysfunction in Parkinson's disease. In the future, we will test the effects of oxidative stress and mitochondrial impairment in our fission yeast model of Parkinson's disease.
INTRODUCTION
Parkinson's disease (PD) is an incurable neurodegenerative disease affecting nearly one million Americans (Olanow and Tatton 1999). In PD patients, neurons in the midbrain (substantia nigra) die, manifesting resting tremors, postural instability, and muscular rigidity (Dawson and Dawson 2003). Proteinaceous deposits, known as Lewy bodies, progressively form in the substantia nigra due to the misfolding and aggregation of α-synuclein (Spillantini et al. 1998). Whether these insoluble aggregates are harmful or helpful to neurons remains to be resolved (Lashuel et al. 2002). Growing evidence suggests, however, that soluble oligomers of α-synuclein, known as protofibrils, are the toxic species in PD (Goldberg and Lansbury 2000). Furthermore, familial mutants of α-synuclein, A53T (Polymeropoulos et al. 1997) and A30P (Kruger et al. 1998) polymerize into protofibrils more quickly than wild-type α-synuclein and subsequently form potentially toxic membrane-bound pores in vitro (Conway et al. 1998; Conway et al. 2000; Lashuel et al. 2002).
Besides the noticeable presence of accumulated α-synuclein in PD brains, not so obvious oxidants build-up and damage other proteins (Alam et al. 1997), DNA (Alam et al. 1997), and lipids (Dexter et al. 1986). These reactive oxygen species (ROS) are principally thought to be generated from dysfunctions in the mitochondria (Abou-Sleiman et al. 2006). Some autosomal dominant and recessive forms of PD are linked to mutations in proteins found in the mitochondria, including PINK1 (Valente et al. 2004), DJ-1 (Bonifati et al. 2003), and LRRK2 (Zimprich et al. 2004). Even Parkinson's disease-related proteins that are not found in the mitochondria, such as parkin (Kitada et al. 1998), impact the function of the mitochondria and health of dopamine-producing neurons (Park et al. 2006; Clark et al. 2006; Yang et al. 2006; Wang et al. 2006). Furthermore, deficiencies in mitochondrial complex I increases neurodegeneration in PD (Mizuno et al. 1989). The inhibition of complex I leads to more ROS, which further inhibits complex I and produces even more ROS (Dauer and Przedborski 2003).
Nevertheless, these are not the only genes involved. Normally, cells are able to regulate ROS insults with detoxifying proteins and molecules like superoxide dismutase (Slot et al. 1986) and glutathione (Thiruchelvam et al. 2005), respectively. Recently, a yeast genetic screen revealed 86 genes that, when knocked out, enhanced α-synuclein toxicity (Willingham et al. 2003). Previously, our lab has used yeast lacking mitochondrial manganese superoxide dismutase (sod2∆) and found that human α-synuclein is necessary for lethality (Sharma et al. 2006). This toxicity was later increased by the addition of hydrogen peroxide. Here, we further characterize α-synuclein toxicity in two more mitochondrial related yeast knockout strains uncovered in Willingham et al. (2003), α-ketoglutarate dehydrogenase (kgd1∆) and glyoxylase II (glo4∆). We also investigated two oxidative stress knockout strains, mitochondrial/peroxisomal catalase A (cta1∆) and cytosolic catalase T (ctt1∆), that were not revealed in the Willingham et al. (2003) genetic screen.
We hypothesize that the combination of human α-synuclein and an above gene deficiency will be toxic to budding yeast (Saccharomyces cerevisiae). Since we have tagged green fluorescent protein (GFP) to α-synuclein, we were able to determine its localization. When toxicity is observed, we believe that α-synuclein will be found localized to the plasma membrane (Sharma et al. 2006). Yet, when toxicity is not observed, we believe α-synuclein will be found in the cytoplasm, membrane, or aggregated. Additionally, cytotoxic cells may exhibit higher levels of oxidative stress at the induction of α-synuclein expression.
MATERIALS AND METHODS
α-Synuclein Expression Vector Constructs
The pYES2.1/V5-His-TOPO yeast expression vector (Invitrogen) was used for all α-synuclein expression in budding yeast. The following four vector constructs were previously created for each experiment: green fluorescent protein (GFP), wild-type α-synuclein, A30P, and A53T isoforms of α-synuclein. These mutants were also tagged at the C-terminus with GFP. For all experiments the pYES2.1/V5-His-TOPO vector and the GFP tagged vector were used as expression controls.
Yeast Strains
The parent budding yeast (Saccharomyces cerevisiae) strain, BY4741 (MATa his31 leu20 met150 ura30) was purchased from Open Biosystems (Huntsville, AL). Two catalase deficient BY4741 budding yeast strains, knocked out for catalase A (cta1∆) and catalase T (ctt1∆), a Krebs cycle enzyme deficient strain, knocked out for α-ketoglutarate dehydrogenase (kgd1Δ), and glutathione deficient strain, knocked out for mitochondrial glyoxalase II (glo4∆) were also bought from Open Biosystems.
Western Analysis
A concentration of 2.5x10⁷ yeast cells/ml were washed in 50 mM Tris (pH 7.5), 10 mM NaN3 and solubilized in Electrophoresis Sample Buffer (ESB; Burke, 2000) containing 2% sodium dodecyl sulfate (SDS), 80 mM Tris (pH 6.8), 10% glycerol, 1.5% dithiothreitol, 1 mg/ml bromophenol blue, and a cocktail of protease inhibitors and solubilizing agents (1% Triton-X 100, 1 mM phenylmethylsulfonyl fluoride, 1 mM benzamidine, 1 mM sodium orthovanadate, 0.7 g/ml pepstatin A, 0.5 g/ml leupeptin, 10 g/ml E64, 2g/ml aprotinin, and 2 g/ml chymostatin). Samples were loaded onto 10-20% Tris-Glycine gels (Invitrogen) using Tris-Glycine-SDS running buffer (pH 8.3). Gels were transferred onto PVDF membranes and immunodetection was done with anti-α-synuclein (1:2000) and anti-V5 AP (1:5000) monoclonal antibodies using standard protocols and detected for alkaline phosphatase activity (NBT/BCIP). A loading control was measured with an anti-PGK monoclonal antibody.
Growth Curve Analysis
Flasks with 25 ml SC-URA galactose were each inoculated to 2.0x10⁶ cells/ml density after overnight growth in SC-URA glucose at 30 C. At 0, 6, 12, 18, 24, 36, and 48 hours, duplicate measurements were taken from each sample. One milliliter of cell culture was pipetted into a cuvet to measure absorbance at 600 nm using a Hitachi U-2000 Spectrophotometer. Spectroscopic growth analysis was repeated at least three times for each strain.
Fluorescence Microscopy
Live cells were visualized under a Nikon TE2000-U fluorescent microscope and images were acquired using the Metamorph 4.0 imaging software. About 750 to 1000 cells were counted at several time-intervals depicted in the growth-rate analysis (18, 24, 36, and 48 hours). For a qualitative analysis, three qualities were assessed and scored: plasma-membrane localization, cytoplasmic aggregates, and/or diffuse fluorescence. A ratio of the fluorescence patterns was created by characterizing about 750 cells according to their dominant phenotype: aggregate, diffuse, or membrane. Non-fluorescent cells were included in the total count to account for general expression levels.
ROS Analysis with Dihydrorhodamine 123
Test tubes with 10 ml of SC-URA galactose were inoculated with cells grown overnight in SC-URA glucose at 30 C. Two hours post-induction of α-synuclein, 20 μL of 2.5 mg/mL dihydrorhodamine 123 (DHR 123) was added to each tube to reach a final concentration of 5μg/mL, as described in Flower et al. (2005). Cells were visualized under a 530-550 nm filter at 3 hours of α-synuclein expression. For quantification, fluorescing and total cells (~750-1000 cells) were counted to determine the percentage of ROS in each condition.
RESULTS
α-Synuclein Progressively Loses Membrane Localization and Forms Aggregates in kgd1Δ
We evaluated the localization of α-synuclein in cta1Δ, cta2∆, glo4Δ, and kgd1Δ budding yeast against the isogenic BY4741 parent strain to understand α-synuclein's properties under conditions of oxidative stress and mitochondrial dysfunction. At two time points, 24 and 48 hours post-induction, fluorescence images were captured to assess the localization of human α-synuclein-GFP (Figure 1). All yeast knockout strains were phenotypically identical to the parent strain except for the kgd1Δ strain. In yeast strains other then kgd1Δ, cells containing the control pYES2.1 vector did not fluoresce (data not shown). Cells with the GFP plasmid showed diffuse fluorescence in the cytoplasm as expected, but not the vacuole. Wild type and A53T-α-synuclein-GFP expression showed intense plasma membrane localization with little or no diffuse fluorescence. Familial α-synuclein-GFP mutant, A30P, exhibited a combination of cytoplasmically diffuse, aggregate, and plasma membrane localized fluorescence patterns.
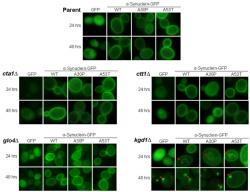
Figure 1. α-Synuclein Localization in Oxidative Stress and Mitochondrial Mutants; Images captured of budding yeast at 24 and 48 hours of α-synuclein expression are shown at 1000x. Here, α-synuclein is tagged to green fluorescent protein (GFP) on the carboxyl-terminus, which allows for analysis of its localization when illuminated at 488 nm. Along with wild-type (WT) α-synuclein, localization of two α-synuclein familial mutants, A30P and A53T, are also shown. All strains show plasma membrane localization of α-synuclein at 24 and 48 hours of induction as described in Sharma et al. (2006). However, only kgd1∆ cells display intracellular aggregates at 24 hours and aggregates near the plasma membrane at 48 hours of α-synuclein expression.
In kgd1Δ at 24 hours of expression, the fluorescence phenotype differed slightly from its parent. A fraction of GFP-expressing cells showed aggregation by forming distinct foci (i.e. concentrated pixel intensity). The α-synuclein isoforms exhibited similar findings. At 48 hours, this change was more prominent. In all kgd1Δ α-synuclein-expressing cells, aggregates of α-synuclein were observed in higher numbers than parent cells. Strikingly, WT and A53T α-synuclein-GFP lost plasma membrane localization, whereupon cytoplasmic inclusions were found. These inclusions were in close proximity to the plasma membrane and were seemingly attached at 48 hours. This result is noted by decreased plasma membrane fluorescence and increased inclusion presence near the cell wall. Surprisingly, inclusions found at 24 hours of expression were not near the plasma membrane, but were situated near the vacuole.
Presence of aggregates in kgd1Δ encouraged taking additional images at 18 and 36 hours, to evaluate the development of inclusions (images not shown). The images captured over the 48 hour time-course were then quantified (~750-1000 cells) according to three attributes: cytoplasmically diffuse, plasma membrane localized, and formation of foci or aggregates (Figure 2). In kgd1Δ, GFP and all isoforms of α-synuclein-GFP showed a gradual progression to aggregate formation in a time-dependent manner. Aggregate formation was accompanied by loss of localization in each characteristic area. Thus, A30P-expressing kgd1Δ cells lost both membrane and cytoplasmic localization as aggregates formed.
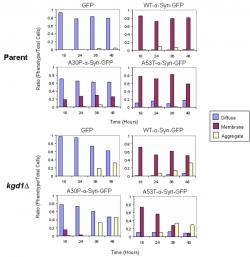
Figure 2. Quantification of α-Synuclein Localization in Parent and kgd1∆ Strains; The ratio of the three fluorescence patterns (i.e. diffuse, membrane, aggregate) was scored from 750 cells at 18, 24, 36, and 48 hours of α-synuclein expression. In the both strains, WT and A53T α-synuclein-GFP show plasma membrane localization. However, in kgd1∆ cells, aggregates accompanied the membrane phenotype. Over the 48 hour time course, aggregates became more prevalent. Both GFP and A30P-α-synuclein predominantly show cytoplasmic localization in each strain, yet in kgd1∆ cells, GFP and A30P-α-synuclein form aggregates similar to WT and A53T α-synuclein-GFP.
α-Synuclein is not Toxic in Any Oxidative Stress and Mitochondrial Mutants
Next we examined toxicity of cta1Δ, cta2∆, glo4Δ, and kgd1Δ by a using a spectroscopic (OD600nm) growth-rate analysis. This technique utilizes the density of cells to correlate degree of toxicity in actively budding yeast. Toxicity was not observed in any knockout strain expressing any isoform of α-synuclein-GFP (Figure 3). Even with the addition of hydrogen peroxide in cta1Δ and cta2∆ cells expressing α-synuclein-GFP, toxicity was not observed (data not shown). Furthermore, non-GFP tagged α-synuclein was not toxic to kgd1Δ yeast (data not shown).
α-Synuclein Expression is Decreased in kgd1Δ
To address the lack of toxicity, α-synuclein expression was measured in kgd1Δ. At 24 hours of induction, kgd1Δ cells expressing all isoforms of α-synuclein showed no expression when compared to the parent strain (Figure 4A). Interestingly, the fluorescence phenotype between both yeast strains showed roughly equivalent α-synuclein expression.

Figure 3. Growth Curve Analysis of Knockout Yeast Expressing α-Synuclein; Absorbance by optical density analysis at 600 nm was assessed over a 48-hour time course where toxicity was not observed in any strain. Error bars represent standard error from three separate growth analyses. Graphs not containing error bars were only repeated once (i.e. cta1∆ and ctt1∆).
These results prompted induction of both strains for a 72-hour time-course to evaluate the change of α-synuclein expression over a longer period of time. We hypothesized that α-synuclein concentration would increase by 72-hours. Thus, cell lysates were prepared at three time points: 24, 48, and 72 hours for GFP and WT-α-synuclein-GFP in kgd1∆, where the parent WT-α-synuclein-GFP served as a control. Surprisingly, protein concentration in neither GFP nor WT-GFP expressing kgd1∆ cells changed (data not shown).

Figure 4. Expression of α-Synuclein in the Parent and kgd1∆ Strains; A. For all samples, α-synuclein-GFP expression was induced for 24 hours and detected using an anti-α-synuclein monoclonal primary antibody (1:2000). In the parent strain, WT, A30P, and A53T α-synuclein-GFP displayed similar expression, however, in the kgd1∆ strain, α-synuclein-GFP expression was diminished. Anti-phosphoglycerate kinase (PGK) primary monoclonal antibody (1:5000) was used as a loading control. Vector denotes the pYES2.1 plasmid without GFP or α-synuclein. Results were verified in a second trial (data not shown). B. Compared to the parent strain, all foreign proteins in kgd1Δ had diminished expression. Additionally, non-GFP tagged WT-α-Synuclein in the parent exhibited increased expression and variable banding when compared to WT-α-Synuclein-GFP. Results were verified in a second trial (data not shown).
We next wanted to determine whether low expression was an α-synuclein specific effect or due to the GFP tag. Thus, WT-α-synuclein (no GFP) was transformed into kgd1∆ to evaluate expression without GFP. Suprisingly, both GFP and WT-α-synuclein (no GFP) in kgd1∆ similarly displayed low expression when compared to the parent at 24 hours of induction (Figure 4B). Additionally, LacZ, a harmless reporter gene, was also transformed into kgd1∆ to evaluate expression of another foreign protein. LacZ also showed diminished expression (data not shown). In general, all foreign proteins transformed into kgd1∆ exhibited decreased expression.
Oxidative Stress does not Enhance α-Synuclein Aggregation in kgd1Δ
Since increased expression of α-synuclein was not inducing aggregation in kgd1Δ cells, we hypothesized that oxidative stress was linked to the visible protein aggregation. To test this, we used dihydrorhodamine 123 (DHR 123) to visualize levels of reactive oxygen species in kgd1Δ and sod2Δ cells in comparison to the parent strain. Given that sod2Δ cells exhibit toxicity when combined with α-synuclein and hydrogen peroxide (Sharma et al. 2006), we used this strain as a positive control for oxidative stress.
When lipid soluble DHR 123 enters the cell and becomes oxidized by ROS, the result is a red fluorescent rhodamine 123 that is impermeable to lipid membranes. In figure 5A, this red fluorescence is seen in both the vector and WT-α-synuclein (no GFP) expressing cells. The red fluorescing cells were then counted and divided over the total cells (~750-1000 cells) imaged in each condition.

Figure 5. Levels of Reactive Oxygen Species in the Parent, kgd1∆, and sod2∆ Strains; A. Images were captured at 3 hours of α-synuclein expression. Dihydrorhodamine 123 (DHR 123) was used to visualize cells containing reactive oxygen species (ROS) with a 530-550 nm filter. The intensity of red corresponds to increasing levels of oxidants. Gross analysis of stained cells does not reveal percentage of oxidatively stressed yeast. The sod2∆ yeast strain was used as a positive control where previous investigations have uncovered toxicity with α-synuclein expression (Sharma et al. 2006). B. Percentage of cells revealing oxidative stress. Surprisingly, kgd1∆ cells expressing WT-α-synuclein showed normal levels of ROS. However, sod2∆ cells expressing WT-α-synuclein showed an elevated level of ROS. Error bars represent the standard error of three separate trials.
Since the loss of kgd1 activity is thought to generate ROS (Tretter and Adam-Vizi 1999), we predicted that kgd1Δ cells not expressing α-synuclein would have higher levels of ROS in comparison to the parent strain. We next hypothesized that ROS would be enhanced with the combination of α-synuclein and kgd1Δ. Surprisingly, this quantification revealed that kgd1Δ cells expressing WT-α-synuclein or not have normal levels of ROS when compared to the parent strain (Figure 5B). In slight contrast to kgd1Δ cells, sod2∆ cells are scavengers of ROS (Thiruchelvam et al. 2005). Expectedly, sod2Δ cells expressing WT-α-synuclein exhibited enhanced ROS levels when compared to all other conditions.
DISCUSSION
The complex interplay between oxidative stress and α-synuclein folding is becoming clearer as we evaluate the role of the mitochondria in Parkinson's disease. Here, we evaluated four yeast strains with different oxidative stress and mitochondrial mutations, cta1∆, ctt1∆, glo4∆, and kgd1∆. All gene deletions affected α-synuclein localization and toxicity in different manners.
Our characterization differs from Willingham et al. (2003) where lethality was found in 86 yeast strains with presence of α-synuclein, including kgd1∆ and glo4∆. Yet, we observed no toxicity in these two knockout strains (Figure 3). Only kgd1∆ displayed time-dependent aggregate formation in all GFP-related proteins combined with the least expression observed. Unexpectedly, the kgd1∆ strain exhibited normal levels of oxidative stress when compared to sod2∆ cells.
No Toxicity
Cells lacking kgd1 display aggregates of α-synuclein but no toxicity (Figures 1, 2, and 3). This could be attributed to a larger cellular environment, thus decreasing the relative concentration and crowding of α-synuclein. Aggregation of α-synuclein is time and concentration dependent (Brandis et al. 2006). Superficially, kgd1∆ cells are larger than the parent strain (data not shown). This increase in size may suppress lethality of α-synuclein by buffering its affects as well as providing a suitable environment for the transcription of additional detoxifying gene products.
Are Aggregates Protective?
Intense debate in the field of neurodegenerative diseases strives to understand if aggregates are toxic or protective. Since α-synuclein-rich Lewy bodies are correlated with Parkinson's disease, much investigation has gone into understanding why and how α-synuclein aggregates (Spillantini et al. 1998). In kgd1∆, toxicity is absent but aggregates are not. Thus, the combination of low expression and aggregation may be a protective mechanism for the cell. Additionally, since aggregates do not form until 24 to 48 hours of expression, we cannot determine whether or not they are toxic since growth reached a plateau phase at that time. In order to asses viability of kgd1∆ cells at 48 hours post α-synuclein induction, a survival assay could be performed (Flower et al. 2005).
Emerging evidence suggests that circular protofibrils are the toxic agent in NDD (Lashuel et. al. 2002). Through a pore-like mechanism they can permeabilize a membrane or vesicle which diminishes the integrity of the cell and its ionic potentiation. Protofibrils are the intermediate of fibrils and are thought to contribute to cytotoxicity more than insoluble aggregates. In our ongoing investigation, toxicity was observed only in sod2∆ cells (Sharma et al. 2006). Since aggregates are not readily found under this condition, we can suggest that this model supports the protofibril hypothesis due to membrane localization in fluorescent cells. Yet, we still do not know whether α-synuclein or oxidative stress is the dominant culprit in their toxicity. Additionally, within our fission yeast model, toxicity is absent in cells with abundant aggregates (Brandis et al. 2006).
Where do α-Synuclein Aggregates Localize?
Notably, aggregation observed in kgd1∆ begins within the cells' interior at 24 hours and moves to the membrane at 48 hours (Figures 1 and 2). We are not sure whether or not the membrane aggregates observed at 48 hours are formed from loss of membrane localization or vesicular transport to the membrane (Caughey et. al. 2003). One clue points to vesicular transport. Since GFP also forms these characteristic aggregates, plasma membrane localization is not necessary for membrane-bound aggregate formation. The same argument applies for A30P-α-synuclein. Yet, this does not discount the idea that retrograde vesicular transport from the membrane may create these distinct aggregates. Both pathways may be operating.
Why are α-Synuclein Steady-State Levels Low in kgd1∆?
If α-synuclein-GFP is visualized in living kgd1∆ cells, why is it not being detected by an immunoblot? There may be two possibilities. One, insoluble aggregates created in kgd1∆ cells may internalize necessary epitopes for antibody binding. This would decrease the antibodies binding affinity for α-synuclein and produce bands with little to no intensity. Figure 4 shows two immunoblots using two different primary antibodies to probe for α-synuclein: anti-α-synuclein and anti-V5 (V5 epitope is found after the α-synuclein cDNA sequence). Seemingly, the anti-V5 IgG was more specific to α-synuclein than anti-α-synuclein itself. This may suggest that the V5 epitope is not concealed as readily during α-synuclein polymerization. Two, kgd1∆ yeast cells may be undergoing autophagy, which is the degradation of organelles through the lysosome (Zabrocki et al. 2005). Enhanced autophagy in kgd1∆ cells could be degrading α-synuclein faster than its being produced.
α-Ketoglutarate Dehydrogenase Model for Parkinson's Disease
With the advent of MPTP studies (Langston et al. 1983), the respiratory chain in the mitochondria has been long considered as a major site of ROS generation. Specifically, inhibition of complex I, NADH ubiquinone oxidoreductase, is a plausible site of ROS production due to its sensitivity to oxidative stress; only 25-30% inhibition of complex I is necessary to induce parkinsonism (Adam-Vizi 2005). Yet, there are other factors that contribute to the toxic redox status in substantia nigra neurons. Increasing ROS levels actually inhibit α-ketoglutarate dehydrogenase, which generates more ROS (Tretter and Adam-Vizi 1999). The inhibition of α-ketoglutarate dehydrogenase reduces NADH for the electron transport chain, thus decreasing ATP production. By these inverse pathways, α-ketoglutarate dehydrogenase is both a target and generator of oxidative stress. However, our lab has been unable to show that yeast lacking α-ketoglutarate dehydrogenase produces quantifiable levels of ROS. This maybe due to yeasts' ability to enter the glyoxylate cycle and regain NADPH levels from upregulating enzymes not found in humans (Satrustegui et al. 1983).
Interestingly, loss of α-ketoglutarate dehydrogenase activity also occurs in Alzheimer's disease (AD). Gibson et al. (1988) have demonstrated that α-ketoglutarate dehydrogenase activity is reduced by 40-75% in AD brains. Reduction in α-ketoglutarate dehydrogenase levels is negatively correlated with neurofibrillary tau tangle counts, suggesting this enzyme is involved in the neurodegenerative cascade.
In summary, our laboratory's investigation of five oxidative stress and mitochondrial knockout yeast strains have characterized α-synuclein's aggregation and toxicity in three completely different ways. Cells lacking kgd1 showed aggregation with no toxicity; cta1∆, ctt1∆, glo4∆ cells displayed no aggregation with no toxicity; and sod2∆ cells exhibited toxicity without aggregation. This research highlights the complexity of mitochondrial dysfunction in Parkinson's disease. Slight differences within any of these genes will regulate α-synuclein properties in very different ways. For instance, although α-ketoglutarate dehydrogenase may not directly interact with α-synuclein, its absence affects α-synuclein's folding and regulation. Despite these gaps in knowledge, one conclusion can be made: α-synuclein interacts with oxidative stress and the mitochondria in PD pathogenesis.
ACKNOWLEDGEMENTS
At Lake Forest College, we thank Dr. Karen Kirk, Douglas Light, Ann Maine, Pliny Smith, Jill Van Newenhizen and undergraduates, Alexandra Ayala, Andrew Ferrier, Michael Fiske, Lokesh Kukreja, Mithaq Vahedi, Stephanie Valtierra, Nengding Wang, and Michael White for their editorial comments. K.B. was supported by the Richter Scholarship Program at Lake Forest College. S.D. was supported by grants from NIH (R15 grant NS048508-01 and NS048508-02), NSF (CCLI 0310627 and MRI 0115919), and Lake Forest College.
REFERENCES
Abou-Sleiman, P. et al. (2006) Expanding insights of mitochondrial dysfunction in Parkinson's disease. Nature Reviews Neuroscience 7, 207-219.
Adam-Vizi, V. (2005) Production of reactive oxygen species in brain mitochondria: contribution by electron transport chain and non-electron transport chain sources. Antioxidants and Redox Signaling 7, 1140-1149.
Alam, Z. et al. (1997) A generalized increase in protein carbonyls in the brain in Parkinson's but not incidental Lewy body disease. Journal of Neurochemistry 69, 1326-1329.
Alam, Z. et al. (1997) Oxidative DNA damage in the parkinsonian brain: an apparent selective increase in 8-hydroxyguanine levels in substantia nigra. Journal of Neurochemistry 69, 1196-1203.
Bonifati, V et al. (2003) DJ-1( PARK7), a novel gene for autosomal recessive, early onset parkinsonism. Neurological Sciences 24, 159-160.
Brandis, K.et al. (2006). α-Synuclein fission yeast model: concentration-dependent aggregation without plasma membrane localization or toxicity. Journal of Molecular Neuroscience 28, 179-191.
Burke, D. et al. (2000) Methods in Yeast Genetics, Cold Spring Harbor Laboratory Press, New York.
Caughey, B. et al. (2003) Protofibrils, pores, fibrils, and neurodegeneration: separating the responsible protein aggregates from the innocent bystanders. Annual Reviews in Neuroscience 26, 267-298.
Clark, I. et al. (2006) Drosophila pink1 is required for mitochondrial function and interacts genetically with parkin. Nature 441, 1162-1166.
Conway, K. et al. (1998) Accelerated in vitro fibril formation by a mutant -synuclein linked to early-onset Parkinson's disease. Nature Medicine 4, 1318-1320.
Conway, K. et al. (2000) Fibrils formed in vitro from -synuclein and two mutant forms linked to Parkinson's disease are typical amyloid. Biochemistry 39, 2552-2563.
Dawson, T. and V. Dawson (2003) Molecular pathways of neurodegeneration in Parkinson's disease. Science 302, 819-822.
Dauer, W. and S. Przedborski (2003) Parkinson's disease: mechanisms and models. Neuron 39, 889-909.
Flower, T. et al. (2005). Heat shock prevents α-synuclein-induced apoptosis in a yeast model of Parkinson's disease. Journal of Molecular Biology 351, 1081-1100.
Gibson, G. et al. (1988) Reduced activities of thiamine-dependent enzymes in the brains and peripheral tissues of patients with Alzheimer's disease. Archives of Neurology 45, 836-840.
Goldberg, M. and P. Lansbury (2000) Is there a cause and effect relationship between α-synuclein fibrillization and Parkinson's disease? Nature Cell Biology 2, E115-119.
Kitada, T. et al. (1998) Mutations in the parkin gene cause autosomal recessive juvenile parkinsonism. Nature 392, 605-608.
Lashuel, H. et al. (2002) α-Synuclein, especially the Parkinson's disease-associated mutants, forms pore-like annular and tubular protofibrils. Journal of Molecular Biology 322, 1089-1102.
Langston, J. et al. (1983) Chronic Parkinsonism in humans due to a product of meperidine-analog synthesis. Science 219, 979-980.
Mizuno, Y. et al. (1989) Deficiencies in complex I subunits of the respiratory chain in Parkinson's disease. Biochemical and biophysical research communications 163, 14501455.
Olanow, C. and W. Tatton (1999) Etiology and pathogenesis of Parkinson's disease.
Annual Review of Neuroscience 22, 123-144.
Park, J et al. (2006) Mitochondrial dysfunction in Drosophila PINK1 mutants is complemented by parkin. Nature 441, 1157-1161.
Satrustegui, J. et al. (1983) NADPH/NADP+ ratio: regulatory implications in yeast glyoxylic acid cycle. Molecular and Cellular Biochemistry 51, 123-127.
Sharma, N. et al. (2006) α-Synuclein budding yeast model: toxicity enhanced by impaired proteasome and oxidative stress. Journal of Molecular Neuroscience 28, 161-178.
Slot, J. et al. (1986) Intracellular localization of the copper-zinc and manganese superoxide dismutases in rat liver parenchymal cells. Laboratory Investigation 55, 363-371.
Spillantini, M et al. (1998) α-Synuclein in filamentous inclusions of Lewy bodies from Parkinson's disease. Proceedings of the National Academy of Sciences of the United States of America 95, 6469-6473.
Thiruchelvam, M. et al. (2005) Overexpression of superoxide dismutase or glutathione peroxidase protects against the paraquat + maneb-induced Parkinson disease phenotype. Journal of Biological Chemistry 280, 22530-22539.
Tretter, L. and V. Adam-Vizi (1999) Inhibition of α-ketoglutarate dehydrogenase due to H2O2-induced oxidative stress in nerve terminals. Annals of the New York Academy of Sciences 893, 412-416.
Valente, E. et al. (2004) Hereditary early-onset Parkinson's disease caused by mutations in PINK1. Science 304, 1158-1160.
Wang, D. et al. (2006) Antioxidants protect PINK1-dependent dopaminergic neurons in Drosophila. Proceedings of the National Academy of Sciences of the United States of America 103, 13520-13525.
Willingham, S. et al. (2003) Yeast genes that enhance the toxicity of a mutant huntingtin or α-synuclein. Science 302, 17691772.
Yang, Y. et al. (2006) Mitochondrial pathology and muscle and dopaminergic neuron degeneration caused by inactivation of Drosophila Pink1 is rescued by Parkin. Proceedings of the National Academy of Sciences of the United States of America 103, 10793-10798.
Zabrocki, P. et al. (2005) Characterization of α-synuclein aggregation and synergistic toxicity with protein tau in yeast. The FEBS Journal 272, 1386-1400.
Zimprich, A. et al. (2004) Mutations in LRRK2 cause autosomal-dominant parkinsonism with pleomorphic pathology. Neuron 44, 601-607.