

Matthew Coleman, Scott Higinbotham, and Aisha Arroyo
Middlesex Community College, 591 Springs Rd, Bedford, MA 01730.
ABSTRACT
Popular elections may be conducted using a wide variety of algorithms, each of which aims to produce a winner reflective, in some way, of the general consensus of the voters. Despite the common objective, electoral algorithms may produce a different winner given the same underlying set of voters and voter preferences. In this study, we characterize the likelihood that two common electoral algorithms, the Plurality algorithm and the Instant-Runoff Voting (IRV) algorithm, produce concordant winners as a function of the underlying dispersion of voter preferences. We use a Monte Carlo simulation to hold one million mock elections using both algorithms and then assess whether winner concordance occurred. For each mock election, the Shannon entropy is calculated to capture all contained information and the Herfindahl–Hirschman Index (HHI) is calculated to capture the concentration of voter preference. We find that the probability that the algorithms produce concordant results in a three-candidate election approaches 100 percent as the ballot dispersion decreases. In contrast, as voters start to consider a wider range of candidates as a viable first-choice, the Plurality and IRV algorithms start to differ in their election outcomes. The potential benefits of adopting an IRV algorithm over a Plurality algorithm must be weighed against the likelihood that the algorithms might produce different results. This study implies that ballot dispersion is a key driver of potential differences in the candidates each voting algorithm elects.
INTRODUCTION
Elections are a social selection structure in which voters express their preferences for a set of candidates. In the most notable cases, such as elections for president or governor, there can only be a single winner. Therefore, voters cast ballots that voice their opinions on which candidate should win, and an algorithm determines which candidate wins based on those votes. The Plurality algorithm is commonly used to convert voter preferences into a declared winner. It is so common that, to many voters, it is synonymous with the very concept of an election (Richie, 2004). In this algorithm, each voter voices a single preference, and the candidate with the most votes wins the election. The Plurality algorithm is far from the only electoral system. Other single-winner algorithms include Approval, Borda Count, Copeland, Instant-Runoff, Kemeny-Young, Score Voting, Ranked Pairs, and Schulze Sequential Dropping. Of these alternative algorithms, we choose to focus on the Instant-Runoff Voting algorithm (IRV). It is used in many elections, including the city elections in Berkeley, California and Cambridge, Massachusetts, the state elections in Maine, and the presidential caucuses in Nevada. Under the IRV system, voters still express a first choice, but also rank the other candidates in order of preference in the event that their first-choice candidate is eliminated. The existence of so many different single-winner algorithms highlight the fundamental challenge with electoral systems. The selection of a winner may depend as much on the choice of algorithm as the will of the voters. This is best demonstrated with the example of a close race between three candidates, with one candidate winning under Plurality, but a separate candidate gaining enough votes to win through IRV.

Underlying Structure of Voter Ballots
In this study, we evaluate the outcomes of a 3-candidate election. The candidates are identified as A, B, and C. Each voter submits a ballot on which they designate their first, second, and third choice preferences. Alternatively, we can describe voters as designating their first and second choice candidates, since their third choice is the remaining candidate by default. Given three candidates, there are a total of 3, or six, possible orderings of these candidates, which represent six unique ballot types as shown in Table 1.
Voting algorithms do not always elect the same candidate. For example, consider the algorithm for Instant-Runoff Voting shown in Table 2, and the series of ballots shown in Table 3. Candidate A wins under Plurality. However, under Instant-Runoff Voting, Candidate B is eliminated in the first round, and Candidate C gains 125 more votes than Candidate A. This makes the final vote 475 to 525, electing Candidate C as opposed to Candidate A.
Each system has its benefits. If a majority of voters only prefer one first-choice candidate and strongly oppose the other candidates, then the candidate that most voters prefer will be elected through Plurality voting. However, if voters have very small differences in their preferences between candidates, we would expect Instant-Runoff Voting to elect the candidate who is preferred on balance.
Plurality vs. Instant-Runoff Voting Algorithms
In a Plurality voting system, each voter is given a ballot from which they must choose one candidate. The candidate that receives the most votes wins, regardless of whether or not they obtain a majority (i.e., 50% or more of the vote). In an Instant-Runoff Voting (IRV) system with full preferential voting, voters are given a ballot on which they indicate a list of candidates in their preferred order. The winner is determined by the algorithm outlined in Table 2.
The Plurality algorithm, though extremely common, suffers from several major disadvantages (Richie, 2004). First, it explicitly ignores all voter preference information beyond the first preference. By doing so, it simplifies the mechanics of the election at the expense of producing an outcome that may not fully incorporate voter desires. Second, it encourages voters to think strategically about their votes, since voting for a candidate without adequate support might have the unintended effect of helping a less desired candidate win. This is known as the “spoiler” problem. Third, the Plurality algorithm may encourage infighting among candidates with otherwise common policy objectives and natural constituencies. The IRV algorithm, on the other hand, attempts to address these concerns by incorporating more information on voter preferences and cross-correlations in support among candidates. Under this algorithm, voters express not only a first choice as in the Plurality algorithm, but an ordered list of preferred candidates (Table 1) which may factor into the determination of a winner. This frees voters from having to guess the behavior of other voters and might encourage candidates with similar natural constituencies to work with rather than against each other.
Many studies comparing the Plurality and IRV algorithms have focused on voter behavior (Burnett and Kogan, 2015) or have presented qualitative arguments as to why candidates might run different styles of campaigns as a result of different electoral structures (Donovan et al., 2016). There have been relatively few studies that use numerical simulations to test the behavior of election algorithms under different conditions. In one such study, Joyner (2019) used machine learning tools to estimate the hypothetical outcome of the 2004 presidential election had it been conducted using the IRV algorithm. In another study, Kilgour et al., (2019) used numerical simulation to determine whether the phenomenon of ballot truncation had an impact on the probability that the winner of an election is also a Condorcet winner, which denotes a candidate that would win all head-to-head elections of competing candidates. Ornstein and Norman (2013) developed a numerical simulation to assess the frequency of nonmonotonicity in IRV elections, a phenomenon where a candidate’s support in the ballots and performance can become inversely related.
However, to our knowledge, no studies have focused on the impact of ballot dispersion on Plurality and IRV election outcomes. One might wonder how the concentration of votes (i.e., a situation where voters usually either support Candidate C over Candidate B over Candidate A, or support Candidate A over Candidate B over Candidate C) affects whether these two algorithms select the same candidate given a random election. In this study, we develop a theoretical approach to determining the circumstances in which the Plurality and IRV algorithms might produce concordant results, and the likelihood that such a result could occur as a function of ballot dispersion. We hypothesize that if the dispersion of voter preferences and ballots increases, then the concordance between Plurality voting and Instant-Runoff Voting should decrease.
This study seeks to determine the behavior and rate of change in algorithmic concordance with respect to ballot dispersion for the purpose of understanding the fundamental differences between the Plurality and Instant-Runoff Voting algorithms. This information may influence electoral policy decisions in the future as more states and municipalities consider different voting algorithms and their impacts on election outcome, candidate behavior, and voter enfranchisement.
METHODS
Mathematical Notations and Definitions
The dispersion, or alternatively the concentration, of the underlying ballot structure can be expressed quantitatively. Shannon entropy is a common method used to assess the information content of a disordered system (Shannon, 1948). In other contexts, concentration has been expressed using the Herfindahl–Hirschman Index (HHI) (Rhoades, 1995). These measures are complementary and help differentiate boundary case elections (i.e., cases where all voters support a single candidate or where ballots are uniformly cast for all candidates) from intermediate case elections where there is an even but nonuniform distribution of ballots. After clustering mock elections on the basis of their Shannon entropy and HHI, we examine how the concentration of votes relates to the concordance or discordance of election winners between the algorithms, i.e., the likelihood that the two algorithms might have produced identical winners.
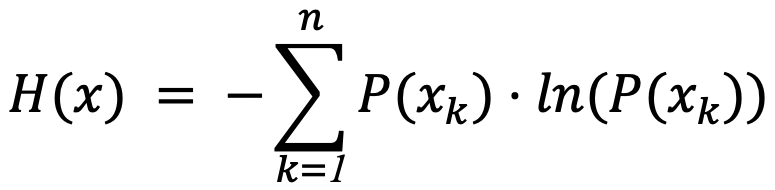
Let x denote a discrete random variable with possible values x1 ... xn , and P(x) denote the probability mass function of x.
Then the Shannon entropy, H(x), is given by:
And the Herfindahl–Hirschman Index, HHI(x), is given by:

Monte Carlo Simulation of Election Winner Concordance
We conducted a numerical simulation in which we generated one million hypothetical elections, calculated the ballot dispersion in each election, and compared the winner of the election using the Plurality and the IRV algorithms. For our analysis, we employ a stochastic Monte Carlo simulation of hypothetical 3 candidate elections. The calculations are sufficiently straightforward and can be performed in a Microsoft Excel spreadsheet as described below. Prior to beginning the simulation, we identify all possible unique voter preference profiles. For a 3 candidate election where every voter ranks the candidates from most to least preferred, there are six unique ballots (Table 1).
For example, consider the results of a mock election as shown in Table 3. Candidate A wins under Plurality. However, employing the IRV algorithm, we eliminate candidate B and redistribute the votes resulting in Candidate C winning under IRV. Since these election methods produce different winners, their concordance is 0. Given the percentage of each ballot permutation cast, we can calculate the HHI and Shannon entropy:

Shannon entropy:

It should be noted that in order to reach certain levels of Shannon entropy and HHI, there must exist a candidate with more than half the votes, which would guarantee the algorithms are concordant. The maximum level of concentration that can be achieved without a guarantee of concordance is when two of the six possible ballots and/or candidates have exactly half of the vote. The HHI of any such situation is:

and the Shannon entropy can be at most:

In the situation where only the first-choice preferences are visible, as in the case of Plurality election, the corresponding boundary conditions for HHI(x) and H(x) are still 0.5 and 0.693147, respectively.
We simulate one million of these individual hypothetical elections. In each election, we determine both the Plurality winner and the IRV winner using the algorithm (Table 2). The Plurality winner in each election is straightforward. In each election for each candidate, we add together the votes for ballots in which the candidate was the first choice. In addition to each simulated election having both a Plurality and IRV winner, it also has a distinct voter preference concentration, which we describe in terms of Shannon entropy and HHI. We calculate two values for each of these statistics. The first is the ballot value and incorporates information across all ballot types. The second is the candidate value and incorporates only information related to voters’ first choice.
In order to determine how often certain amounts of entropy and HHI levels relate to concordance, we need many elections with identical levels of entropy and HHI. This is not achievable through the given method, as we cannot generate a random election based purely off of the HHI or entropy, and it is numerically unlikely we will obtain two different elections with the same entropy or HHI. In order to account for and remedy this issue, we uniformly divide the range of the possible values of entropy and HHI into 100 equal segments (hereafter referred to as bins), and then calculate the average concordance of all elections with entropy or HHI within those bins. The bins are ordered from least concentrated to most concentrated (i.e., the HHI bins start with bin 1 at the boundary case of HHI(x) = 1/6, and end with bin 100 at the boundary case of HHI(x) = 1,whereas the entropy bins start with bin 1 at the boundary case of H(x) = ln(6), and end with bin 100 at the boundary case of H(x) = 0).
In the most common Plurality elections, outside observers only have access to partial information about the ballot dispersion. In these elections, each ballot contains only a single choice. Second choices are not collected. However, we can calculate the HHI and Shannon entropy of these first choices and show how their dispersion relates to the probability of concordant election outcomes, had they been the first round in an IRV election. We describe these relationships as “candidate” concordance. The candidate HHI ranges from 1/3 to 1. The candidate Shannon entropy ranges from 0 to ln(3). Both of these measurements share the same cutoff for guaranteed concordance as their corresponding ballot concentration counterparts.
RESULTS
In Figures 1 - 5, we present the results of one million simulated elections, illustrating the probability of winner concordance on the basis of ballot concentration and entropy. The concordance of election results based on the ballot Shannon entropy is shown in Figure 1. Concordance of election results increased as Shannon entropy decreased across bins 1-63 before leveling off at 100% after bin 63. Concordance rose from a 75% likelihood in bins where ballots had the highest levels of Shannon entropy to a 100% likelihood of concordance in the boundary case.
The concordance of election results based on the ballot HHI is shown in Figure 2. Concordance of election results increased as HHI decreased across bins 1 - 40 before leveling off at 100% after bin 40. Concordance rose from a 75% likelihood in bins where ballots had the highest levels of HHI to a 100% likelihood of concordance in the boundary case.
The concordance of election results based on the candidate Shannon entropy is shown in figure 3. Concordance of election results increased as Shannon entropy decreased across bins 1 - 38 before leveling off at 100% after bin 38. Concordance rose from a 57% likelihood in bins where ballots had the highest levels of Shannon entropy to a 100% likelihood of concordance in the boundary case.
The concordance of election results based on the candidate HHI is shown in Figure 4. Concordance of election results increased as HHI decreased across bins 1 - 26 before leveling off at 100% after bin 26. Concordance rose from a 56% likelihood in bins where ballots had the highest levels of HHI to a 100% likelihood of concordance in the boundary case.
Figure 5 displays the concordance based on thepercentage of the vote that the Plurality winner possessed. We see that there is a 50% likelihood of concordance when the winner has about one-third of the total vote, and the likelihood increases until eventually reaching 100% after the plurality winner obtains 50% of the vote.
DISCUSSION
We find that when there is not a single winner with an absolute majority in the first round of voting, a decrease in Shannon entropy and/or an increase in HHI (represented by an increase in the bin numbers) results in a decrease in algorithmic concordance. (Figures 1 - 4).
Our analysis suggests that concordance between Plurality and IRV algorithms increases alongside the ballot concentration, with the probability of concordance depending on whether Shannon entropy or HHI is used to measure that concentration. Thus, greater preference dispersion results in lower concordance as hypothesized. Higher degrees of voter preference concentration, or lower Shannon entropy, tends to increase the potential for winner concordance. We also prove that electoral outcomes are guaranteed to be concordant above a certain level of ballot concentration. Further, we can use the results of our simulations to illustrate candidate concordance.
General Findings
The results show that in a 3 candidate election, an increase in the concentration of votes causes an increase in the concordance of the election algorithms. Simply put, as voter preferences become more evenly distributed (i.e., there are few differences between the number of voters expressing interest in any particular ballot), it becomes more likely that the election systems will disagree. However, as the preferences further concentrate, it becomes increasingly likely that the election algorithms will agree. When one specific ballot has more than half the votes, the election algorithms always agree.
We earlier showed that there is a certain threshold for both the HHI and the entropy after which the algorithms will be concordant. For the HHI, this point is located at 0.5, meaning that the Plurality and IRV algorithms with HHI above 0.5 are guaranteed to be concordant. For the Shannon entropy, this point is at approximately 0.6931, meaning that elections with Shannon entropy lower than 0.6931 are guaranteed to be concordant. All of the data simulated agreed with this fact.
In a three-candidate election, the third-place candidate in both election algorithms is determined by the first-choice preferences, and thus is always unaffected by the choice of algorithm. Thus all non-concordant elections are elections where the second-place candidate under Plurality is elected under IRV. In other words, for three candidates, IRV benefits the second-place candidate and harms the first-place candidate, except in two boundary cases. These are the cases where one candidate has a majority of first-choice, or the likelihood that the two algorithms might have produced identical winners based only on first choice preferences votes, and the other being the case where all first-choice votes for the third candidate have the Plurality winner as their second choice.
The relationship between ballot concentration and winner concordance can be observed even in the absence of full voter preference information. For example, the Shannon entropy and HHI can be calculated using only voters’ first choice preferences. The candidate information cases illustrate similar outcomes. In cases of low ballot concentration (or high entropy) there is a lower tendency for winner concordance.
Another particularly interesting outcome is our ability to estimate how likely a Plurality election winner would have been concordant with the IRV winner when the Plurality winningpercentage is the only available information. As shown in Figure 5, the likelihood of winner concordance approaches one hundred% when one candidate achieves close to a majority of first-choice preferences. However, the likelihood of concordance drops rapidly when no candidate dominates, and approaches 50% when the candidate with the most first-choice ballots only modestly surpasses the next most preferred candidate.
One of the challenges with this approach is that since the votes by ballot are generated randomly, they tend to be very evenly distributed (randomness, especially uniform randomness, tends to carry very high Shannon entropy and low HHI), and thus most data tend to fall into the lower bins. As a result, many of the higher bins did not receive any data, despite the usage of an exponential distribution to make the randomized data less uniform. Fortunately, the bins that received no data were exclusively after the point where the algorithms are guaranteed to be concordant.
Despite the seemingly drastic results of the data, most of the circumstances in which there would be a low chance of concordance require unusual distributions of voters (e.g., all three candidates must be quite similar in the size of their support). These situations are extremely uncommon in a two-party system, where the third-party candidate generally garners little support. As a result, there is very little difference in the algorithms for a two-party system
Opportunities for Further Research
This paper presents only the initial steps on a longer inquiry. Further enhancements to this research would be to (i) study N-candidate elections (rather than only three candidates), (ii) evaluate different methods to produce hypothetical voter preference concentrations, and (iii) perform a comparative analysis on alternative electoral algorithms.
There are many questions that arise from these results. The most immediate question is how the concordance would be affected in a general N-candidate election. The reasons for this are unclear and warrant further study. Since the number of elections that could be simulated was limited to one million hypothetical elections, there are opportunities to increase the sample size. In order to utilize a finer bin size without having bins that receive no data, the sample size would need to be drastically increased, likely requiring a different methodology for obtaining and storing data and/or more robust modeling.
This paper addresses only the likelihood of winner concordance when comparing the Plurality and IRV algorithms. The approach is broadly extensible to comparisons between other electoral algorithms.
ACKNOWLEDGMENTS
Writing this paper would not have been possible without help from Middlesex Community College Professors Scott Higinbotham and Aisha Arroyo who provided me with critical guidance in the direction and methodologies of this paper.
REFERENCES
Burnett, C. M. and Kogan, V. (2015). Ballot (and voter) “exhaustion” under instant runoff voting: An examination of four ranked-choice elections, Electoral Studies, 37, 41-49. Available: www.doi.org/10.1016/j.electstud.2014.11.006.
Donovan, T., Tolbert, C., and Gracey, K. (2016). Campaign civility under preferential and plurality voting. Electoral Studies, 42, 157-163. Available:www.doi.org/10.1016/j.electstud.2016.02.009.
Joyner, N. (2019), Utilization of machine learning to simulate the implementation of instant runoff voting, SIAM Undergraduate Research Online, 12, 282-304. Available: www.doi.org/10.1137/18S016709
Kilgour, D. M., Grégoire, J. and Foley, A. M. (2019) The prevalence and consequences of ballot truncation in ranked-choice elections. Public Choice. Available: www.doi.org/10.1007/s11127-019-00723-2.
Ornstein, J. and Norman, R. (2013). Frequency of monotonicity failure under Instant Runoff Voting: estimates based on a spatial model of elections. Public Choice, 161. Available: www.doi.org/10.1007/s11127-013-0118-2.
Richie, R. (2004). Instant runoff voting: What Mexico (and others) could learn. Election Law Journal, 3(3), 501-512. Available: www.doi.org/10.1089/1533129041492150.
Rhoades, S. A. (1995). Market share inequality, the HHI, and other measures of the firm composition of a market. Review of Industrial Organization, 10, 657-674. Available: www.doi.org/10.1007/BF01024300.
Shannon, C. E. (1948) A mathematical theory of communication. Bell System Technical Journal, 27(3), 379-423. Available: www.doi.org/10.1002/j.1538-7305.1948.tb00917.x.