Priscilla Detweiler*, Angelica Morales Cueva*, Katherine Hickey, Alana Giordano, Colleen Kingsepp, Jasmine Jimenez, Brian Ford, Sara Bergonzi, Mary Kusenda PhD, Jodi Evans PhD
Molloy University, 1000 Hempstead Ave Rockville Centre, NY, 11570
Abstract
Osteoarthritis (OA) is one of the most significant health problems of today’s time. Three dimensional culture models are a major tool used by researchers to study cartilage degeneration associated with OA. The objective was to improve upon current 3D culture models. The hypothesis was that atelocollagen, when added to a hyaluronan matrix, enhances the chondrogenic development of bone-marrow derived mesenchymal stem cells (MSC). Additionally, these 3D cultures can be used to model inflammation-induced cartilage degradation. The experiment was organized into two phases. Phase I focused on the development of cartilage through the 3D culture of MSCs and Phase II, focused on the inflammation-induced degradation of the cultures. Conditioned mediums from naive and inflamed macrophages were added to the cultures after development and they were eventually processed for the purposes of histology and gene expression analysis. During Phase I, atelocollagen added to the hyaluronan matrix, significantly increased the gene expression of COLL II and decreased that of MMP13 when compared to hyaluronan alone, indicating improved matrix formation. This was reflected in histological analyses, as both the change in interstitial matrix and territorial matrix grade were greater in the cultures with atelocollagen. After inflammation exposure, there was a significant decrease in COLLII expression with a concomitant increase in MMP13 expression in both cultures indicating inflammation-induced degradation. Therefore, this new model of developing cartilage from MSC with hyaluronan and atelocollagen creates an articular cartilage model that acts like real cartilage in both healthy and damaged states.
Key words: osteoarthritis, mesenchymal stem cells, hyaluronan, atelocollagen
Introduction
Osteoarthritis (OA) is one of the most common biological degenerative forms of arthritis and is commonly associated with aging. Osteoarthritis occurs when the articular cartilage, the cartilage that protects and cushions the end of the bone, degenerates over time (Bernstein et al. 2010). Most adults will have knee cartilage degradation or exhibit osteoarthritis in at least one joint by the time they are 60 years old (Sun et al. 2011). Traditionally, OA was thought to be a result of “wear and tear”, but current research has shown that inflammation contributes considerably to degeneration (Woodell-May and Sommerfeld 2020). Pro-inflammatory macrophages of affected joints are a primary source of cytokines that contribute to the degradation of the cartilage matrix (Sun et al. 2011).
The current clinical treatments for osteoarthritis relieve symptoms by reducing inflammation and associated pain. Although there is some pain relief with non-steroidal anti-inflammatory drugs (NSAIDs), this is only a temporary solution due to the limitations of their use (Hwang et al. 2021). Essentially, these treatments are pain management and do not reverse or slow the progression of damaged cartilage. There is a significant need to develop therapeutics that promote the regeneration of cartilage.
3D culture models are used to study degenerative changes in OA and test potential therapeutics. These models mimic real joints but are man-made so researchers can use life-like joints that are not from humans or animals. Researchers can use these models to mimic physiological conditions. They provide an accessible way to observe variations among cellular environments and the interactions between cells and their surrounding extracellular matrix (Samvelyan et al. 2021). Although 3D culture models are an improvement from 2D cultures, they also have limitations and researchers seek to find improved matrices and methods to mimic in vivo conditions.
Many 3D models of articular cartilage are based on the development of cartilage cells from mesenchymal stem cells (MSC). MSCs are the precursor cells to all connective tissue cells, including cartilage cells (Mescher and Junqueira 2016). These cells are grown within a support matrix designed to mimic a real joint. Many support matrices include hyaluronan, a major component of cartilage matrix, along with other matrix proteins found in cartilage (Mescher and Junqueira 2016). Finding the right combination of biomaterials and culture conditions is imperative to the translation of results from studies using 3D culture to the clinic. Kim et al. (2020) found that atelocollagen added to a 3D culture matrix enhanced chondrogenic differentiation of adipose derived MSC. Atelocollagen is a derivative of collagen produced by protease treatment to remove the telopeptides at both ends of the collagen molecule. The goal was to determine if the addition of atelocollagen to a hyaluronan-based matrix would improve differentiation of bone marrow derived MSC. Additionally, this study sought to determine the impact of atelocollagen on inflammation-induced cartilage degradation using conditioned medium from activated macrophage cells analogous to in vivo conditions of OA. The hypothesis is if atelocollagen is added to the chondrogenic matrix of bone marrow derived MSC, then articular cartilage cell development will be enhanced. Further, if a medium that has been conditioned by activated macrophage cells is added, then OA degeneration will be reiterated in this 3D model.
Methods and materials
Materials
All cell culture media, trypsin, fetal bovine serum (FBS) and antibiotic/antimycotic (100 U/mL penicillin sodium, 100 U/mL streptomycin sulfate and 0.25 µg/mL amphotericin B) solutions were obtained from Thermofisher Scientific (Waltham, MA, USA). The LADMAC macrophage/monocyte (CRL-2420) and C3H/HeJ mouse I-13.35 splenic cell lines (CRL-2471) were purchased from the American Type Tissue Collection (ATCC) (Manassas, VA, USA). Endotoxin tested (less than 0.1 ng/μg) IFNγ (#I1000) was purchased from US Biological (Salem, MA, USA), gamma irradiated LPS from Escherichia coli (#L4391), the iScript Advanced cDNA Synthesis kit and SsoAdvanced Universal SYBR Green supermix were from Bio-Rad, Inc and the Griess Reagent System from Promega, Madison, WI, USA. All other chemicals and reagents were purchased from Sigma-Aldrich (St. Louis, MO, USA) unless otherwise specified.
RNA was quantified using a NanoDrop spectrophotometer (Thermofisher), real-time PCR was carried out using the CFX96 Touch Real-Time PCR System from Bio-Rad, images from the histology slides were acquired using an Accuscope 3000-LED series microscope coupled to an Accuscope Excelis HD camera equipped with an SD card and data was analyzed using Graphpad Prism 9.0 software.
Methods
3D culture, RNA extraction, reverse transcription, quantitative PCR, griess reaction, membrane based antibody array (Proteome Profiler), enzyme-linked immunosorbant assay (ELISA), paraffin embedding, sectioning, Masson’s trichrome stain, image capture, ImageJ program, t-test, 2-way analysis of variance (ANOVA) and Šidák’s post-test for individual comparisons after 2-way ANOVA were used.
Bone marrow derived mesenchymal progenitor cells (D1)
D1 ORL UVA (D1) cells, a bone marrow-derived mesenchymal stem cell line, were obtained from the American Type Culture Collection (ATCC #CRL-12424) and maintained in DMEM supplemented with 10% FBS, 100 U/mL penicillin sodium, 100 U/mL streptomycin sulfate and 0.25 µg/mL amphotericin B (growth medium).
3D Culture
D1 cells were suspended at 107 per 1 mL of HyStem™ (HYS020-1KT) hyaluronic acid based hydrogel (Sigma-Aldrich, St. Louis, MO). For the hyaluronan groups 0.25 mL of thiol linker (Extralink) was added and for hyaluronan + atelocollagen 0.125 mL thiol linker (Extralink) and 0.125 mL atelocollagen was added. After gentle mixing by pipetting, 0.90 ml of cell suspension was added to the center of cell culture-inserts (8.0 um pore size) in 24-well dishes. After 20 min, growth medium was added to the lower chamber of the well with the insert. After 2 days, the medium was changed to a chondrogenic differentiation medium (DMEM supplemented with 1X insulin-transferrin-selenium, 50 ug/mL ascorbic acid 2 phosphate, 40 ug/mL L-proline, 100 nM dexamethasone, 50 ng/mL TGFβ1, 100 U/mL penicillin sodium, 100 U/mL streptomycin sulfate and 0.25 µg/mL amphotericin B.. The cells were differentiated for 3 weeks before exposure to MΦ, control medium and M1, inflammatory medium to induce inflammation. Conditioned medium was diluted 1:10 in chondrogenic medium without TGFβ1 at each medium change. After three weeks, replicate cultures were processed either for histology or RNA extraction.
Macrophage cell line (MΦ)
The C3H/HeJ mouse I-13.35 splenic macrophage cell line was maintained in DMEM supplemented with 10% FBS, 20% LADMAC cell-conditioned medium, 100 U/mL penicillin sodium, 100 U/mL streptomycin sulfate and 0.25 µg/mL amphotericin B. The LADMAC conditioned medium was prepared as suggested by the ATCC. The LADMAC cells produced CSF 1/M-CSF which supported the growth of the splenic macrophage (SpMΦ) cell line (Evans et al., 2015).
Preparation of conditioned medium
Macrophage cells were cultured in serum-free DMEM supplemented with 0.02% BSA and were left alone (MΦ) or activated with LPS (100 ng/mL) and IFN-γ (250 ng/mL) to induce the M1 phenotype. Conditioned medium (CM) was collected from the cultures after 16 hours of incubation, sterile filtered and stored at -20℃ until used in Phase II studies.
Nitrite measurements
Nitrite, as a reflection of NO production, was measured in the cell culture supernatant by using the Griess Reagent System (Promega, Madison, WI, USA), in accordance with the instructions of the manufacturer. The Griess Reagent System uses sulfanilamide and N-1- napthylethylenediamine dihydrochloride (NED) under acidic (phosphoric acid) conditions to detect NO2–in tissue culture medium.
Secreted Cytokine Measurements
Using a Proteome Profiler Mouse Cytokine Array Kit, Panel A from R&D Systems (Minneapolis, MN) the cytokine profile of the M1 conditioned medium was analyzed. The array is a membrane-based sandwich enzyme-linked immunosorbent assay. Condition mediums were first mixed with a cocktail of biotinylated detection antibodies and then incubated with the array membrane which is spotted in duplicate with capture antibodies to specific cytokines and chemokines. Captured proteins were visualized using chemiluminescent detection reagents x-ray film and developer. The signal produced is proportional to the amount of analyte bound. Signal intensities were determined using ImageJ software (NIH).
ELISA
Tumor Necrosis Factor-alpha (TNF-α), a pro-inflammatory cytokine, was also measured using enzyme linked immunosorbent assay (Ready Set-go ELISA) from EBiosciences. Samples were diluted 25X in the assay buffer for analysis to ensure measurements would fall within the detection range of the assay and allow for accurate interpolation.
Real-Time Reverse Transcription PCR
To obtain total RNA, the cultures were homogenized in 1 mL TRIzol solution (ThermoFisher) using a Bel-Art microtube homogenizer (pestle and tube) from Fisher Scientific and then frozen at -80°C at least overnight. Mechanical homogenization is necessary to release cells from the matrix and ensure the disruption of cell and nuclear membranes. After thawing the culture, RNA extraction was carried out according to the manufacturer’s instructions. Briefly, 200 µl chloroform was added, followed by vigorous shaking for 30s. Samples were allowed to stand for 2 minutes followed by centrifugation at 10,000 rpm for 15 min at 4°C. The aqueous layer was added to 500 µl of isopropanol and allowed to stand for 10 min to precipitate the RNA. Samples were then centrifuged at 10,000 rpm for 10 minutes at 4°C. The supernatant was decanted, 1 mL 75% ethanol was added, followed by gentle vortex. Samples were then centrifuged again at 7,500 rpm at 4°C, the supernatant decanted, pellets air-dried, re-suspended in RNAse-free water and quantified using a Nano-drop spectrophotometer (Thermofisher).
To measure matrix associated gene expression, total RNA, 2 ug, was reversed transcribed into complementary DNA (cDNA) using the iScript Advanced cDNA Synthesis kit (Bio-Rad). Real-time quantitative polymerase chain reaction (QPCR) was carried out using SsoAdvanced Universal SYBR Green master-mix and the CFX96 Touch Real-Time PCR System from Bio Rad. cDNA was diluted 10X with RNAse -free water and 5 µl cDNA used per reaction. Primer sequences were specific for mice: matrix metallopeptidase 13 (MMP13), collagen type II (COLL II), glyceraldehyde 3-phosphate dehydrogenase (GAPDH) and β-actin. COLL II, forward 5’-GCCAGGATGCCCGAAAATTA -3’, COLL II reverse 5’-TTGTCACCACGATCACCTCT -3’. MMP13 forward 5’-GGAGCCCTGATGTTTCCCAT-3’, MMP13 reverse 5’- GTCTTCATCGCCTGGACCATA-3’, GAPDH forward 5’-TGGATTTGGACGCATTGGTC-3’, GAPDH reverse 5’-TTTGCACTGGTACGTGTTGAT-3’ and β-actin forward 5’ GGCTGTATTCCCCTCCATCG-3’, β-actin reverse 5’ CCAGTTGGTAACAATGCCATGT-3’.
Quantitative PCR was carried out using a 3-step amplification protocol followed by a melt curve. The parameters were 95⁰C for 3 mins followed by 40 cycles of 95⁰C for 10s, 55⁰C for 15s, 72⁰C for 15s. After each 72⁰C, elongation step, the intensity of the SYBR green fluorophore was detected. At the end of 40 cycles, a melt cycle was performed. GAPDH and β-Actin were used as reference genes to normalize the data among samples.
Histology
After each phase, 3D cultures were fixed in 10% phosphate buffered formalin for 24 hours before dehydration and paraffin embedding. After embedding in paraffin, 7 µm sections were mounted on glass slides. Sections were stained using a modified Masson’s trichrome stain in preparation for image capture and analysis. For the analysis, the mounted slides were analyzed using brightfield microscopy at 100X magnification to assess intensity of collagen staining of the interstitial matrix and 400X magnification to assess the intensity of collagen staining of the territorial matrix. Under blinded conditions, at least 2 sections per replicate in each group were analyzed by 2 members of the research group.
Statistical Analysis
For the histology data analysis, Phase I was analyzed using Welch’s test. Gene expression for Phase I was analyzed using a t-test. Histology and gene expressions for Phase II data was analyzed using a two-way analysis of variance (ANOVA). Post hoc test p values were adjusted using the Šidák’s test. All tests were two-tailed and a nominal significance level of 0.05 was used. All analyses were carried out using GraphPad Prism 9 software.
Results
Gene Expression
COLL II expression was increased and MMP13 expression was decreased in 3D chondrogenic cultures grown in hyaluronan with atelocollagen.
Phase I of this study established a baseline for COLL II and MMP13 expression levels in a chondrogenic environment. COLL II was measured because it is a major component of the articular cartilage matrix, providing a cushion between the bones (Zhang et al. 2009). MMP13 was measured because MMP13 is known to break down cartilage (Raman et al. 2018). Hence, high levels of COLL II expression and low levels of MMP13 expression are ideal for maintaining healthy cartilage. At the end of the developmental Phase I shown in Figure 1, there was a 2.3-fold increase in COLL II expression when atelocollagen was added to hyaluronan compared to hyaluronan alone (Fig. 1A). There was a 2.0-fold decrease in MMP13 expression when atelocollagen was added to hyaluronan compared to hyaluronan alone (Fig. 1B).

Figure 1. Gene expression of COLL II (A) was increased and MMP13 expression (B) decreased in 3D chondrogenic cultures grown in hyaluronan with atelocollagen. Gene expression data was measured via quantitative RT-PCR after 3 weeks of growth under chondrogenic conditions. Hyaluronan (H) and hyaluronan with atelocollagen (HA). Data are presented as mean ± SEM, n= 4-5, ** p < 0.01, *** p < 0.001 determined by t-test.
Cytokine and nitric oxide profile of conditioned medium from inflammatory M1 macrophage cell cultures.
Cytokines disturb the catabolic and anabolic processes in the joint tissues when they are mechanically overloaded. Nitric oxide (NO) is produced by M1 macrophages in response to inflammatory mediators and is used as a marker of inflammation. Cytokines and nitric oxide were measured to understand the profile and relative concentration of cytokines in the conditioned medium being used as the inflammatory agent.
NO levels in conditioned medium, from naïve MΦ were undetectable while in M1 conditioned medium they were 30.9 µm. In Figure 2 and Table 1, relative concentrations of cytokines in CM from inflammatory M1 macrophage cultures and naive macrophage MΦ cultures are presented, and measured with a proteome profiler. This data is consistent with the profile of an inflamed M1 macrophage and common cytokines associated with OA joint and cartilage degradation (Wojdasiewicz et al 2014) was detected. For example, TNF-α was increased 3.6-fold compared to the MΦ CM. Interleukin-1 receptor antagonist (IL-1ra/IL-1F3), an important natural anti-inflammatory protein in arthritis, was also increased ~55.6-fold (Skelly et al. 2018).
The profiler, based on antigen-antibody interactions, only provides data on relative concentrations, therefore ELISA was used to confirm and quantify the difference in TNF-α concentration, where MΦ conditioned medium contained 0.786 ng/mL TNF-α and M1 conditioned medium contained 2.83 ng/mL TNF-α.

Figure 2. Cytokine profile of conditioned medium from M1 macrophage conditioned medium. Mouse cytokine Proteome Profiler immunoblots representing data presented in Table 1 are shown. M1 Cultures were activated with LPS (100 ng/mL) + IFNγ (250 ng/mL) for 24 hr. Ovals highlight cytokine/chemokines whose expression is changed in M1 CM. The square boxes indicate internal control reference spots used to normalize densitometric data. Densitometry was carried out using ImageJ. Coordinates of cytokines spotted in replicate are referenced after the cytokine name in Table 1.
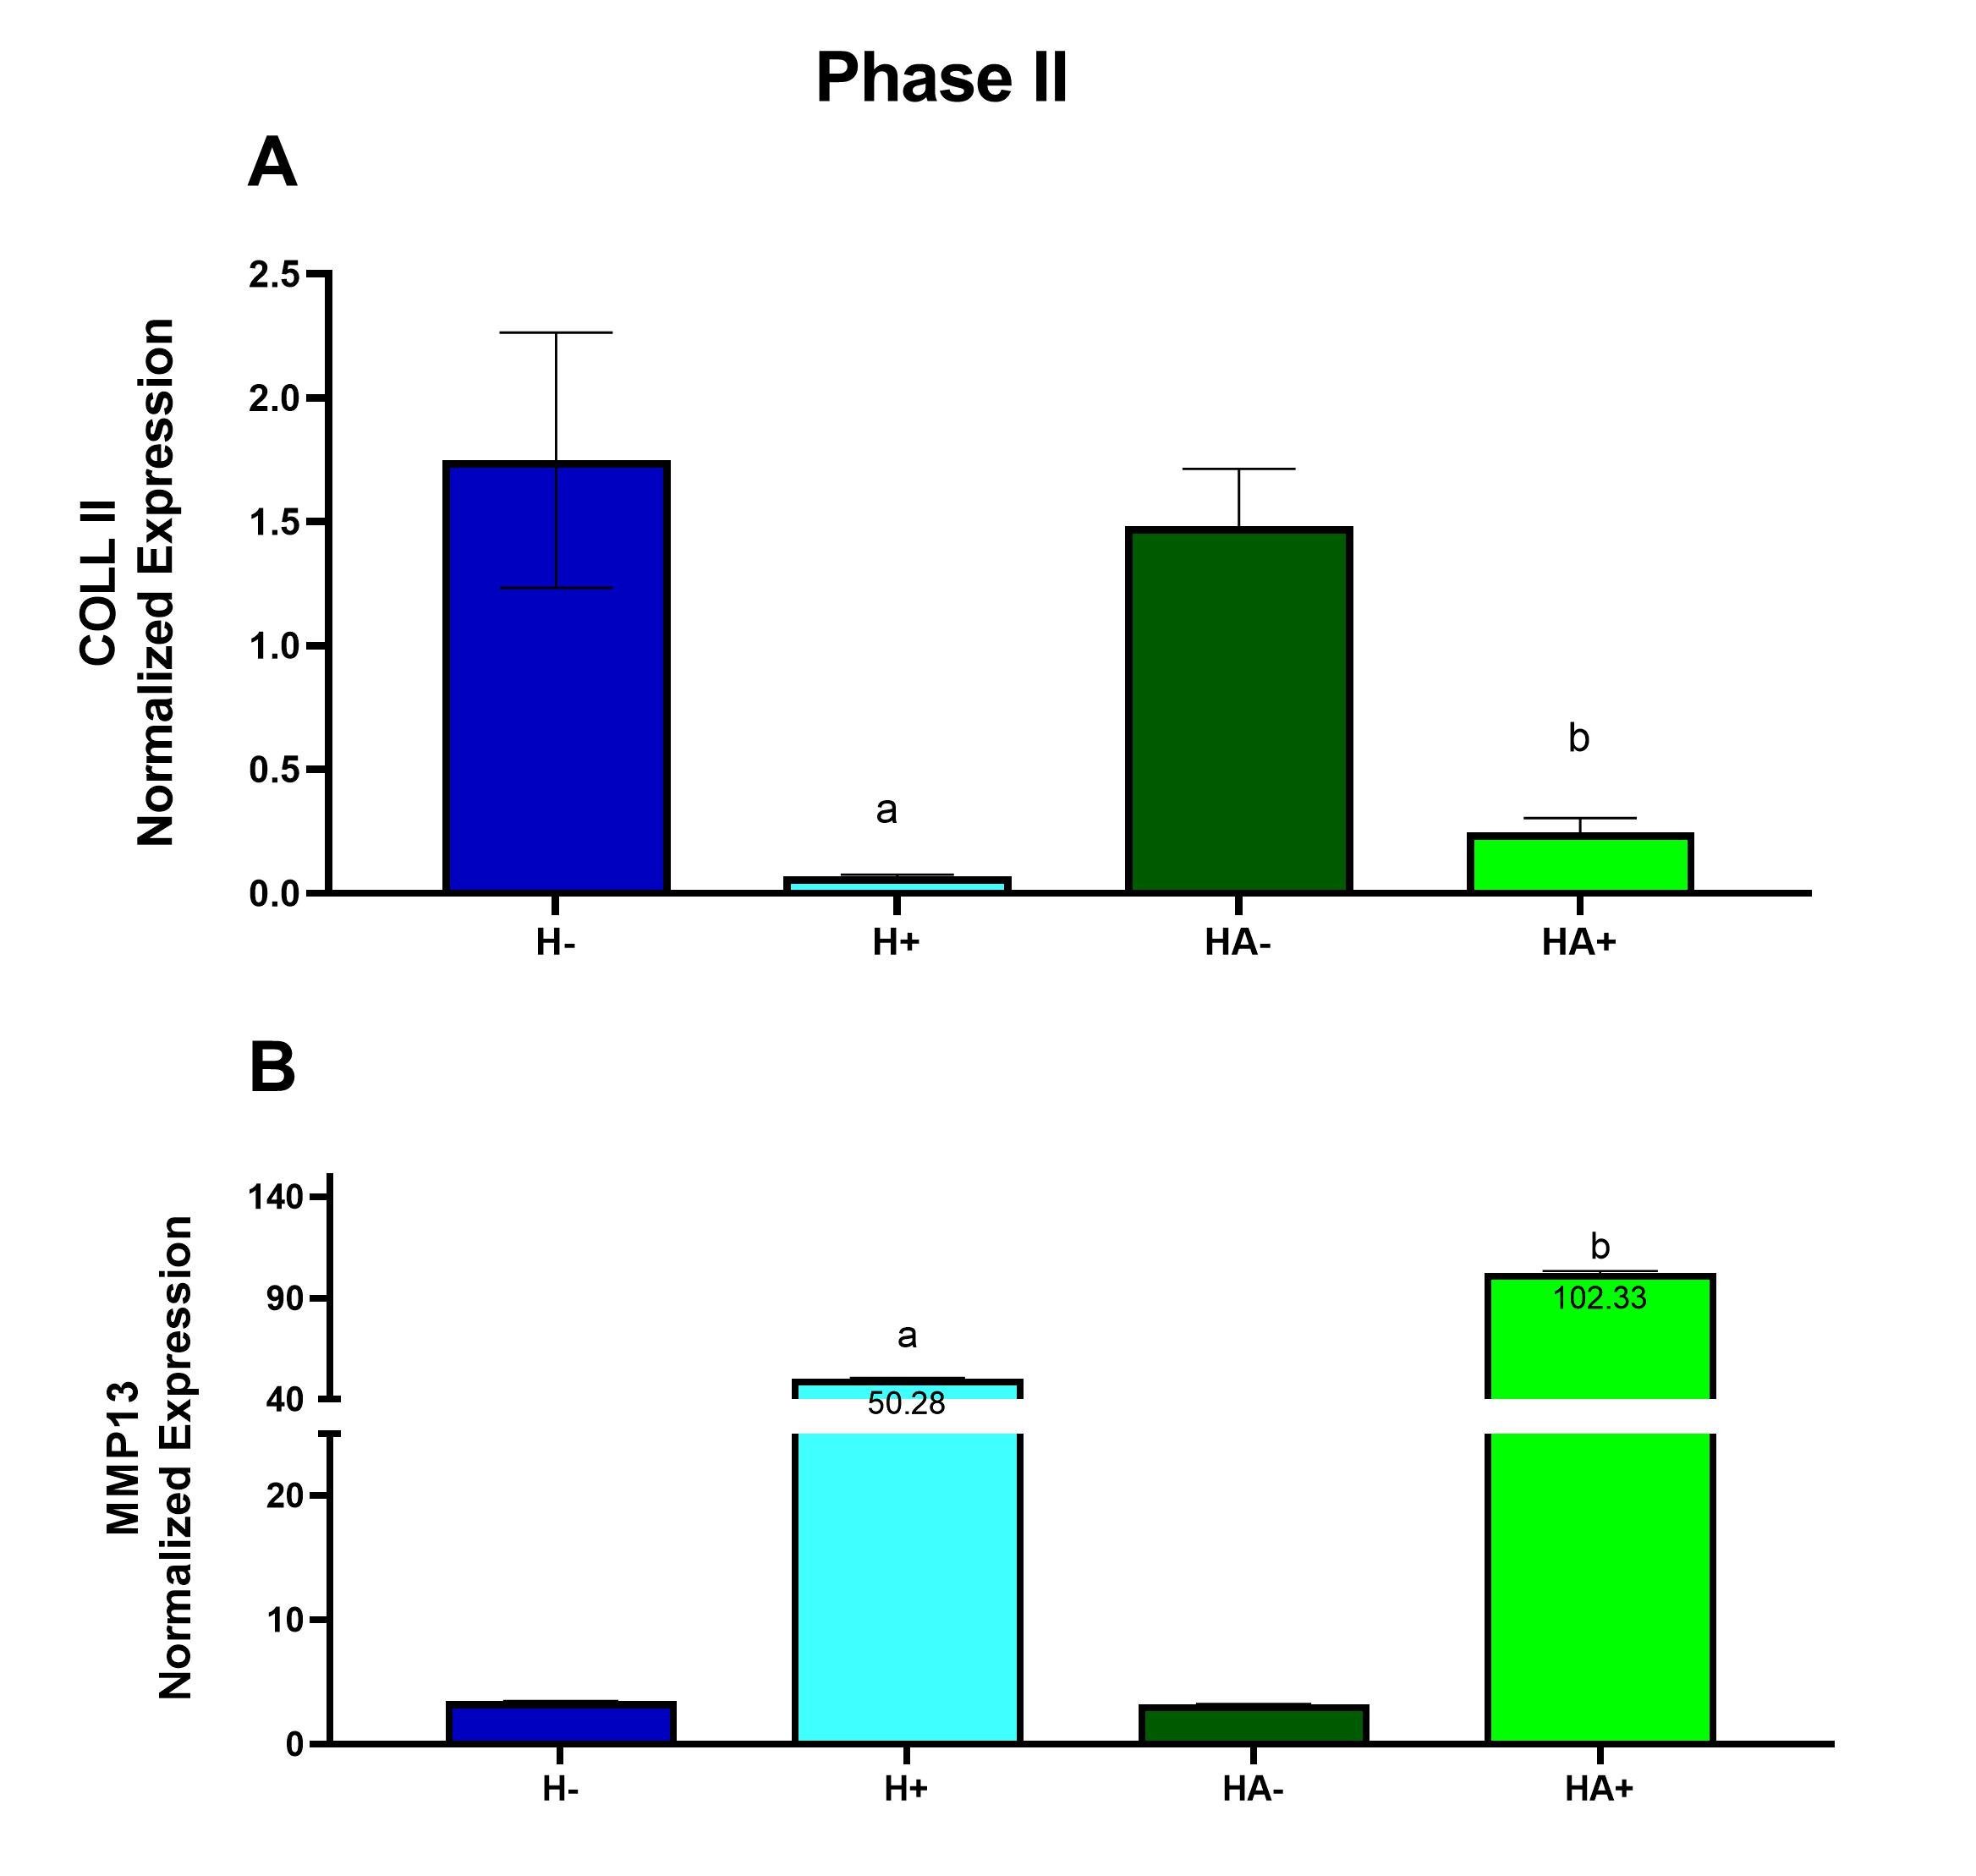
Cytokine M1/M0 G-CSF (B 5,6) + / - GM-CSF (B7,8) + / - sICAM-1 / CD54 (B13,14) + / - IFN-γ (B15,16) + / - IL-1ra / IL-1F3 (B21,22) 55.58 IL-6 (C7,8) + / - IL-27 (C23,24) + / - IP-10 / CXCL10/CRG-2 (D1,2) + / - KC / CXCL1 (D5,6) 2.53 MCP-5 / CCL12 (D11,12) + / - RANTES / CCL5 (D21,22) + / - TNF-α (E5,6) 3.59 Under inflammatory conditions gene expression of MMP13 is increased in 3D chondrogenic cultures grown in hyaluronan with atelocollagen compared to hyaluronan alone. If atelocollagen is appropriate in an inflammatory model, COLL II expression should decrease because the cartilage begins to degrade. MMP13 is an enzyme known to break down cartilage, therefore after inflammation MMP13 expression should increase (Wang et al., 2013). At the end of the inflammatory Phase II, there was a ~26-fold decrease in COLL II expression when inflammation was induced in the culture containing only hyaluronan compared to non-inflammatory conditions (Fig. 3A). There was a ~6.0-fold decrease in COLL II expression when inflammation was induced in the culture containing hyaluronan and atelocollagen when compared to non-inflammatory conditions (Fig. 3A). There was a ~15-fold increase in MMP13 expression when inflammation was induced in the culture containing only hyaluronan and a ~32- fold increase in MMP13 expression when inflammation was induced in the culture containing hyaluronan and atelocollagen when compared to non-inflammatory conditions (Fig. 3B). Figure 3. Under inflammatory conditions gene expression of MMP13 is increased in 3D chondrogenic cultures grown in hyaluronan with atelocollagen compared to hyaluronan alone. Gene expression was measured using quantitative RT-PCR after 3 weeks of exposure to conditioned medium from M1 macrophage cells. Expression was normalized using β-actin and GAPDH. Hyaluronan (H) and hyaluronan with atelocollagen (HA) exposed to conditioned medium from naive macrophage (-) or from inflammatory M1 macrophage (+). Data are presented as mean ± SEM, n = 4-5, a - statistically different from (-) counterpart, b - statistically different from hyaluronan alone. Differences determined after a significant 2-way ANOVA using Šidák’s post-test Histology Atelocollagen with hyaluronan exhibited a higher collagen grade within the interstitial matrices and yielded a greater change in territorial matrix from Phase I to II. To determine the impact of atelocollagen on the development of the collagen matrix, histologic sections from each group were stained using Masson’s trichrome to demonstrate the presence of collagen. The intensity of the green-stained collagen fibers of the interstitial matrix and the territorial matrix in the sections was analyzed using a grading system of 0-4. The grading system was classified as follows: 0- little to no staining, 1- light staining, 2- light to medium staining, 3- medium to intense staining and 4- intense staining. At the end of the developmental Phase I shown in Figure 4A, there was a 4.3-fold increase in the interstitial matrix containing hyaluronan with atelocollagen and a 1.8-fold increase in the territorial matrix containing hyaluronan with atelocollagen compared to hyaluronan alone. In Figure 4B changes in the territorial matrix from Phase I to Phase II are presented as representing the increased chondrogenesis in the hyaluronan with atelocollagen cultures. Figure 5 presents images of this change. Figure 4. Atelocollagen with hyaluronan exhibited a higher collagen grade within the interstitial matrices and yielded a greater change in territorial matrix from Phase I to Phase II. Histologic sections from each group were stained using Masson’s trichrome. A grading system was applied to assess the intensity of collagen staining. (A) Bar graph depicting interstitial matrix grade. (B) Bar graph showing change in territorial matrix grade from Phase I to Phase II. Data presented as mean +/- SEM, *p <0.001 determined using t-test. Figure 5. Histologic sections demonstrating a greater change in territorial matrix among 3D cultures grown in hyaluronan and atelocollagen when compared to atelocollagen alone. Masson’s trichrome stained sections of (A) Phase I, hyaluronan (B) Phase II, hyaluronan, (C) Phase I, hyaluronan + atelocollagen, (D) Phase II, hyaluronan + atelocollagen. Hyaluronic with atelocollagen displayed greater numbers of isogenous groups. Numbers of isogenous groups of chondrocytes were counted under 100x magnification. Isogenous groups of cells can be used as indicators of chondrogenesis since isogenous groups are part of hyaline cartilage morphology (Tsanaktsidou et al. 2020). At the end of the inflammatory Phase II, there was a decrease in the number of isogenous groups in the hyaluronan culture exposed to inflammation compared to the control hyaluronan culture. However, in cultures with hyaluronan and atelocollagen, isogenous groups did not decrease with inflammation. A 2-way ANOVA with Šidák’s post-test showed a significant difference with p <0.001 (Fig. 6A&B). Figure 6. After inflammation, isogenous groups of chondrocytes were reduced only in the cultures with hyaluronan alone. Histologic sections from each group were stained using Masson’s trichrome. Numbers of isogenous groups were counted under 100x magnification. (A) Bar graph depicting numbers of isogenous groups. Data presented as mean +/- SEM, *p < 0.001 determined after a significant 2-way ANOVA using Šidák’s post-test. (B) Representative images of Masson’s trichrome stained sections, 100X magnification. (H-) – hyaluronan alone, (H+) – hyaluronan alone exposed to CM from M1 macrophages, (HA-) – hyaluronan with atelocollagen, (HA+) – hyaluronan with atelocollagen exposed to CM form M1 macrophages. Discussion Osteoarthritis is a degenerative disease affecting the articular cartilage. Current therapeutic approaches focus on alleviating symptoms without contributing to prevention of degradation. Understanding how degradation occurs can assist in the prevention of cartilage degradation. Refinements and improvements to current 3D culture models are needed to better understand cartilage degradation in OA. In the current study, the impact of an atelocollagen supplemented hyaluronan-based 3D matrix on chondrogenic differentiation of mesenchymal stem cells (Phase I) and its ability to recapitulate inflammation induced damage was assessed (Phase II). In Phase I, the hyaluronan with atelocollagen model demonstrated improved chondrogenesis over hyaluronan alone evidenced by increased expression of COLII and lower expression of MMP13. When MMPs are elevated, they alter the function of collagen fibers such as COLL II. COLL II starts to lose its matrix components making the cartilage more susceptible to degradation (Willard et al. 2014). Therefore, adding atelocollagen to a hyaluronan matrix can increase COLL II expression and decrease MMP13 expression providing a strong model of cartilage development from the MSC precursor. Histology analyses support these results and revealed increased interstitial matrix at the end of Phase I and greater change in the territorial matrix in the atelocollagen groups from Phase I to Phase II. The territorial collagen matrix, produced by chondrocytes, is critical for their sustainability and maintenance (Van der Kraan et al. 2002) while the interstitial matrix will resist compression and provide structural support for cellular components (Kvietys et al. 2010). When exposed to inflammatory conditions, cultures with atelocollagen added to hyaluronan demonstrated decreased COLL II expression and increased MMP13 expression. This is in line with other previous works that have confirmed inflammatory mediators upregulate MMP13 expression and downregulate COLL II expression in human chondrogenic cells (Hu and Ecker 2021, Sun et al. 2011). Similarly, Willard et al. (2014) discovered under inflammatory conditions, pluripotent stem cell derived chondrocytes upregulate MMP13 gene expression and decrease COL2A1 gene expression. The parallel between the study and the data from previous studies indicate this model is appropriate for future studies of inflammation induced OA. When observing the number of isogenous groups in the samples with hyaluronan and hyaluronan with atelocollagen in Phase II, the groups with atelocollagen contained more isogenous groups than in the hyaluronan group alone. This data shows that after inducing inflammation, the added atelocollagen prevented suppression of the cellularity of the cultures. In addition to inflammatory cytokines, the conditioned medium from M1 inflammatory macrophage cells contained significant concentrations of interleukin-1 receptor antagonist (IL 1ra/IL-1F3). IL-1ra is an important anti-inflammatory cytokine in arthritis. The fact that M1 macrophage also secreted IL-1ra emphasizes the need to investigate its role in OA and its impact on 3D models of OA. Animal models are used frequently to study human health and disease and there is a similar chondrogenic differentiation period between human and mouse MSC; mouse MSC undergo chondrogenic differentiation in 6 weeks while human MSC take 7 weeks. Additionally, the expression of extracellular matrix proteins in human and mouse MSC remain the same when grown in a 3D hyaluronan scaffold (Zavan et al., 2007), hence using mouse MSC to imitate human MSC in a 3D model is advantageous (Scuteri et al., 2014). However, the use of mouse cells can also be a limitation. New cell therapeutic approaches developed using mouse models are not always effective when tested in humans. There is a need to humanize mouse models to provide greater efficacy in OA studies (Schinnerling et al., 2019). A recovery phase would be a logical next step to test this model. A recovery phase might elucidate the role of the anti-inflammatory or M2 macrophage in the recovering state after inflammation has been induced. Moreover, the observance of a recovery phase and introduction of potential therapeutic factors can provide insights on how to reverse or protect cartilage against induced damage. It is important to study the pathology of OA to find new therapies that expand beyond the symptomatic treatment of OA and focus on regeneration. Moving beyond the paradigm to treat an individual’s symptoms but rather to improve cartilage development can be more impactful in today’s medical field. In short, this research developed baseline chondrogenic cultures, which were then exposed to inflammatory mediators. This confirmed that atelocollagen enhances chondrogenic development of bone marrow derived MSC when added to a hyaluronan matrix. Atelocollagen added to hyaluronan recapitulates inflammation induced damage as evidenced by significant elevations in MMP13 expression and reduction in COLL II expression while conserving isogenous chondrocyte groups. Despite its prevalence among the aging population, pathophysiological mechanisms of OA have yet to be elucidated. Hence, adding atelocollagen to hyaluronan is an appropriate model to be applied to future research of inflammation-induced OA. Conflicts of interest The authors declare no conflict(s) of interest. Acknowledgements We would like to acknowledge the support from the Biology Chemistry and Environmental Science department at Molloy University. AMC, JJ, BF and SB were supported with scholarship funds through the Molloy University ASPIRE program (S-STEM, NSF #1741980). References Bernstein, P., Sticht, C., Jacobi, A., Liebers, C., Manthey, S., Stiehler, M. (2010) ‘Expression pattern differences between osteoarthritic chondrocytes and mesenchymal stem cells during chondrogenic differentiation, Osteoarthritis and Cartilage, 18(12), 1596–1607. Evans, J.F., Salvador, V., George, S., Trevino-Gutierrez, C., Nunez, C. (2015) ‘Mouse aorta derived mesenchymal progenitor cells contribute to and enhance the immune response of macrophage cells under inflammatory conditions, Stem Cell Research & Therapy, 6(1), 56. Hu, Q., Ecker, M. (2021) ‘Overview of MMP-13 as a Promising Target for the Treatment of Osteoarthritis’. International journal of molecular sciences, 22(4), 1742. Hwang, J.J., Choi, J., Rim, Y.A., Nam, Y., Ju, J.H. (2021) ‘Application of Induced Pluripotent Stem Cells for Disease Modeling and 3D Model Construction: Focus on Osteoarthritis’, Cells, 10(11), 3032. Kim, S.A., Sur, Y.J., Cho, M.-L., Go, E.J., Kim, Y.H., Shetty, A.A., Kim, S.J. (2020) ‘Atelocollagen promotes chondrogenic differentiation of human adipose-derived mesenchymal stem cells’, Scientific Reports, 10(1), 10678. Kvietys, P.R., Granger, D.N. (2010) ‘Role of intestinal lymphatics in interstitial volume regulation and transmucosal water transport’, Annals of the New York Academy of Sciences, 1207(Suppl 1), E29. Mescher, A.L. and Junqueira, L.C.U. (2016) Junqueira’s Basic Histology: Text and Atlas [online], available: https://accessmedicine.mhmedical.com/book.aspx?bookid=1687 [accessed 5 Jul 2022]. Raman, S., FitzGerald, U., Murphy, J.M. (2018) ‘Interplay of Inflammatory Mediators with Epigenetics and Cartilage Modifications in Osteoarthritis’, Frontiers in Bioengineering and Biotechnology, 6, 22. Samvelyan, H.J., Hughes, D., Stevens, C., Staines, K.A. (2021) ‘Models of Osteoarthritis: Relevance and New Insights’, Calcified Tissue International, 109(3), 243–256. Schinnerling, K., Rosas, C., Soto, L., Thomas, R., Aguillón, J.C. (2019) ‘Humanized Mouse Models of Rheumatoid Arthritis for Studies on Immunopathogenesis and Preclinical Testing of Cell-Based Therapies’, Frontiers in Immunology, 10, available: https://www.frontiersin.org/article/10.3389/fimmu.2019.00203 [accessed 18 Feb 2022]. Scuteri, A., Donzelli, E., Foudah, D., Caldara, C., Redondo, J., D’Amico, G., Tredici, G., Miloso, M. (2014) ‘Mesengenic Differentiation: Comparison of Human and Rat Bone Marrow Mesenchymal Stem Cells’, International Journal of Stem Cells, 7(2), 127–134. Skelly, D.T., Griffin, É.W., Murray, C.L., Harney, S., O’Boyle, C., Hennessy, E., Dansereau, M.-A., Nazmi, A., Tortorelli, L., Rawlins, J.N., Bannerman, D.M., and Cunningham, C. (2018) ‘Acute transient cognitive dysfunction and acute brain injury induced by systemic inflammation occur by dissociable IL-1-dependent mechanisms’, Molecular Psychiatry, 24, 1533-1548. Sun, L., Wang, X., Kaplan, D.L. (2011) ‘A 3D cartilage – Inflammatory cell culture system for the modeling of human osteoarthritis’, Biomaterials, 32(24), 5581–5589. Tsanaktsidou, E., Kammona, O., Labude, N., Neuss, S., Krüger, M., Kock, L., Kiparissides, C. (2020) ‘Biomimetic Cell-Laden MeHA Hydrogels for the Regeneration of Cartilage Tissue’, Polymers, 12(7). Van der Kraan, P. M., Buma, P., van Kuppevelt, T., van Den Berg, W.B. (2002) ‘Interaction of chondrocytes, extracellular matrix and growth factors: relevance for articular cartilage tissue engineering’, Osteoarthritis and Cartilage, 10(8), 631–637. Wang, M., Sampson, E., Jin, H., Li, J., Ke, Q., Im, H.-J., Chen, D. (2013) ‘MMP13 is a critical target gene during the progression of osteoarthritis’, Arthritis Research & Therapy, 15(1), p. R5. Willard, V.P., Diekman, B.O., Sanchez-Adams, J., Christoforou, N., Leong, K.W., Guilak, F. (2014) ‘Use of Cartilage Derived From Murine Induced Pluripotent Stem Cells for Osteoarthritis Drug Screening: An iPSC-Based Model of OA’, Arthritis & Rheumatology, 66(11), 3062–3072. Wojdasiewicz, P., Poniatowski, Ł.A., Szukiewicz, D. (2014) ‘The Role of Inflammatory and Anti-Inflammatory Cytokines in the Pathogenesis of Osteoarthritis’, Mediators of Inflammation, 2014, 1–19. Woodell-May, J.E., Sommerfeld, S.D. (2020) ‘Role of Inflammation and the Immune System in the Progression of Osteoarthritis’, Journal of Orthopaedic Research, 38(2), 253–257. Zavan, B., Giorgi, C., Bagnara, G.P., Vindigni, V., Abatangelo, G., Cortivo, R. (2007) ‘Osteogenic and chondrogenic differentiation: comparison of human and rat bone marrow mesenchymal stem cells cultured into polymeric scaffolds’, European journal of histochemistry: EJH, 51 Suppl 1, 1–8. Zhang, Y., Markova, D., Im, H.-J., Hu, W., Thonar, E.J.-M.A., He, T.-C., An, H.S., Phillips, F.M., Anderson, D.G. (2009) ‘Primary Bovine Intervertebral Disc Cells Transduced with Adenovirus Overexpressing 12 BMPs and Sox9 Maintain Appropriate Phenotype’, American Journal of Physical Medicine & Rehabilitation, 88(6), 455–463.Table 1. Cytokine profile of conditioned medium from the M1 inflammatory macrophage determined through the proteome profiler immunoblots presented in Figure 2.