

ANDREA ZHU, OREN WEI, ALBERT LEE, ARYAN BOROLE, SELENA KIM, DANIEL LEONGOMEZ, ANUSHKA VAKIL
Johns Hopkins University, Baltimore, MD 21218, USA
ABSTRACT
As COVID-19 uproots millions of lives globally, it is crucial to understand the virus’s transmission routes. One such route, aerosol transmission, has been largely ignored by global health leaders until recently, despite surmounting evidence supporting its prevalence. Aerosols (droplet nuclei <5 μm in diameter) are produced during routine respiratory functions, can remain suspended in the air over prolonged durations and distances and can carry infectious SARS-CoV-2 particles. Thus, it is imperative that universities implement solutions to prevent SARS-CoV-2 aerosol transmission in spaces at risk for infectious aerosol buildup, namely enclosed, high-occupancy spaces. This paper investigates the dynamics of SARS-CoV-2 aerosol transmission and identifies the best practices that institutions should follow to minimize classroom aerosol transmission. Through reviewing literature on the transmission of several respiratory diseases (SARS-CoV-1, SARS-CoV-2, influenza, and tuberculosis) and modeling aerosol spread in classroom scenarios using computational fluid dynamics (CFD) models, this group proposes solutions to minimize SARS-CoV-2 aerosol transmission. Novel CFD models of two Johns Hopkins University (JHU) classroom spaces analyzed the effects of four variables — seating arrangement, window opening, door opening, air purifier placement (AP) — on classroom airflow and identified distinct airflow patterns for different scenarios. Informed by CFD model results and previous literature, suggestions to mitigate aerosol transmission include decreasing class sizes, rearranging students to minimize exposure, opening doors and windows, upgrading HVAC filters, strategically installing portable APs, disinfecting, and implementing behavioral regulations. These solutions can further be generalized to many types of enclosed spaces, with only minor adjustments necessary to account for airflow pattern differences.
INTRODUCTION
Understanding the transmission mechanisms of SARS-CoV-2 is critical for preventing its transmission. Current research on COVID-19 epidemiology focuses heavily on droplet transmission. Droplet transmission occurs when infectious droplets larger than 5 µm in diameter travel directly from the respiratory tract of an infected host to the mucous membranes of a susceptible individual (Tellier et al., 2019). Droplets largely fall within 6 feet of the expulsion site due to the forces of gravity (Mittal et al., 2020; Wells, 1934).On the other hand, aerosols or droplet nuclei, which are extremely small (<5 µm), are less affected by gravity and are more susceptible to ambient airflow patterns when moving around spaces (Jones and Brosseau, 2015; Mittal et al., 2020; Tellier et al., 2019). Thus, the key difference between droplet and aerosol transmission lies in the distance traveled: droplets generally travel shorter distances and remain airborne for a shorter time period when compared to aerosols. Both droplets and aerosols arise from the mucosa of the respiratory tract through routine respiratory functions such as talking, coughing, sneezing, and even breathing (Anderson et al., 2020; Morawska et al., 2020). It is estimated that 80-90% of emitted particles from respiratory activities by healthy humans are aerosols smaller than 1 µm in size (Papineni and Rosenthal, 1997). Thus, in enclosed, poorly ventilated spaces that people occupy for long durations, the buildup of infectious aerosols poses a risk for COVID-19 spread. Safety guidelines provided by the Centers for Disease Control (CDC), including maintaining a distance of 6 feet from others, disinfecting surfaces, washing hands, and wearing a mask, are primarily aimed at preventing droplet transmission and fail to adequately address aerosol transmission (CDC, 2020b).
There is significant evidence of SARS-CoV-2 aerosol transmission (Morawska and Milton, 2020; Zhang et al., 2020). An outbreak in Seattle, Washington from a Skagit Valley Choral practice presents a case study for aerosol transmission of SARS-CoV-2. In this particular outbreak, a startling 53 of the 61 members of the chorale present during this 2.5-hour practice contracted COVID-19 despite social distancing. While a portion of these cases may have arisen from droplet transmission, the poor ventilation, long exposure times and singing (which is known to produce more aerosols than talking) are suspected to have played a significant role in enabling infection, especially between members that did not engage in close contact (Hamner et al., 2020). In another outbreak in a restaurant in Guangzhou, China, one asymptomatic individual infected patrons at nearby tables, some more than 6 feet apart, with no direct contact with those patrons. The resulting infections were consistent with airflow patterns in the room, suggesting aerosol transmission (Lu et al., 2020). Additionally, samples taken from air exhaust fans from a COVID-19 ward in a Singapore hospital and a hospital in Wuhan, China tested positive for SARS-CoV-2 RNA, implying the existence of aerosolized virus (Guo et al., 2020; Ong et al., 2020). Thus, current evidence shows that these virus-containing aerosols that pose a risk of exposure across longer distances are an important route of transmission of SARS-CoV-2 (Morawska and Milton, 2020).
Indoor spaces are particularly good enablers of SARS- CoV-2 aerosol transmission. Unlike outdoor spaces where infectious virus particles can disperse and diffuse effectively, virus particles can build up and concentrate indoors (Morawska et al., 2020). Outdoor spaces not only naturally create ideal ventilation environments, but also pro- vide environments where exposed viral particles can be irradiated and deactivated by ultraviolet (UV) and visible light. In fact, SARS-CoV-2 concentrations in imitation saliva aerosols decreased 90% in 6 minutes when exposed to sun- light compared to 90% in 125 minutes in darkness (Schuit et al., 2020). Thus, due to an indoor environment’s decreased ventilation and exposure to UV and natural light compared to outdoor environments, enclosed spaces particularly enable the aerosol spread of SARS-CoV-2.
Policies regarding school reopening vary widely, from some institutions having adopted a full virtual model to others remaining committed to in-person instruction. The authors hypothesize that a variety of aerosol mitigation techniques can be determined through a literature review and independent CFD modeling. In particular, the authors theorize that a thorough literature review can illuminate feasible ventilation solutions (improving ventilation and filtration practices), temperature and humidity solutions (minimizing aerosol spread through temperature and humidity manipulation), disinfection solutions (ultraviolet and chemical disinfectants targeting aerosols), and personal protective equipment (PPE) solutions (masks) to mitigate aerosol transmission. Additionally, the authors hypothesize that novel CFD classroom analyses can reveal aerosol mitigation solutions regarding optimal seating arrangements, portable filter placement and door and window statuses.
No prior studies have constructed CFD analyses based on real classrooms with modeled humans to investigate exhalation flow patterns of students and professors. This study notably uses the mechanical drawings of two well- trafficked classrooms on JHU’s Homewood Campus to reconstruct accurate 3D models for CFD modeling. Additionally, while previous studies have generated CFD models of small, generic classrooms, this study uniquely looks at how seating arrangements, AP positioning and door and window openings change CFD results of accurate reconstructions (Abuhegazy et al., 2020; Song and Meng, 2015).
As COVID-19 cases continue to surge nationwide, this comprehensive assessment of classroom aerosol transmission mitigation solutions collected from previous literature and novel CFD analyses has important implications on universities’ COVID-19 practices. While this study used JHU as a reference, many of this paper’s proposed solutions can be generalized to other institutions, enabling this study to pro- vide guidance on the best practices for classroom reopenings across the country.
METHODS
This paper combines literature review and original research. The literature review references and compiles existing research regarding SARS-CoV-2 transmission, bioaerosol properties, and known solutions for minimizing bioaerosol spread. The other portion of this paper presents original data from CFD modeling of two classroom spaces from the JHU Homewood Campus to illustrate airflow patterns in typical classrooms and to identify effective mitigatory solutions.
Classroom Models
A mid-sized classroom and lecture hall were selected to model aerosol flow in classrooms. A roughly rectangular classroom and a larger, semi-circular lecture hall auditorium were modeled in SolidWorks. These reconstructions were based on precise mechanical drawings of two classrooms in Hodson Hall provided by the JHU facilities team, with students and professors approximated as rectangular blocks with square mouth openings and typical classroom solid desk furniture built to scale (Table 1).

The mid-sized classroom is 10.5 m in length, 7.4 m in width and 3.0 m in height, containing one window and one door at opposite ends and 6 overhead vents. The modeled cuboid professor at the front is approximated with height 1.6 m, width 0.3 m and length 0.3 m, and a mouth outlet measuring (0.05 x 0.05) m2 located 1.5 m from the ground. The students are cuboid with height 1 m, width 0.3 m and length 0.3 m, and a mouth outlet measuring (0.05 x 0.05) m2 located 0.9 m from the ground. At full capacity, the room seats 15 students, each occupying one desk space, arranged with 1.6 m between the rows, 1.8 m between adjacent students and 2.4 m between students diagonally (Figure 1). A minimum distance of 1.8 m was chosen due to national and global distancing guidelines CDC (2020b). Fluid dynamics analysis was performed on this room configuration in three scenarios. In scenario 1, neither the door nor window was open (set as pressure outlet). In scenario 2, only the door was treated as open. In scenario 3, the window and door were both treated as open. The room configuration was also altered in a reduced occupancy (staggered) formation, where 7 students were placed each at a desk to maximize distance between each student, at a minimum of 2.4 m apart (Figure 2). In this configuration, two scenarios were examined (scenarios 4 and 5), mirroring the circumstances of scenarios 1 and 2.
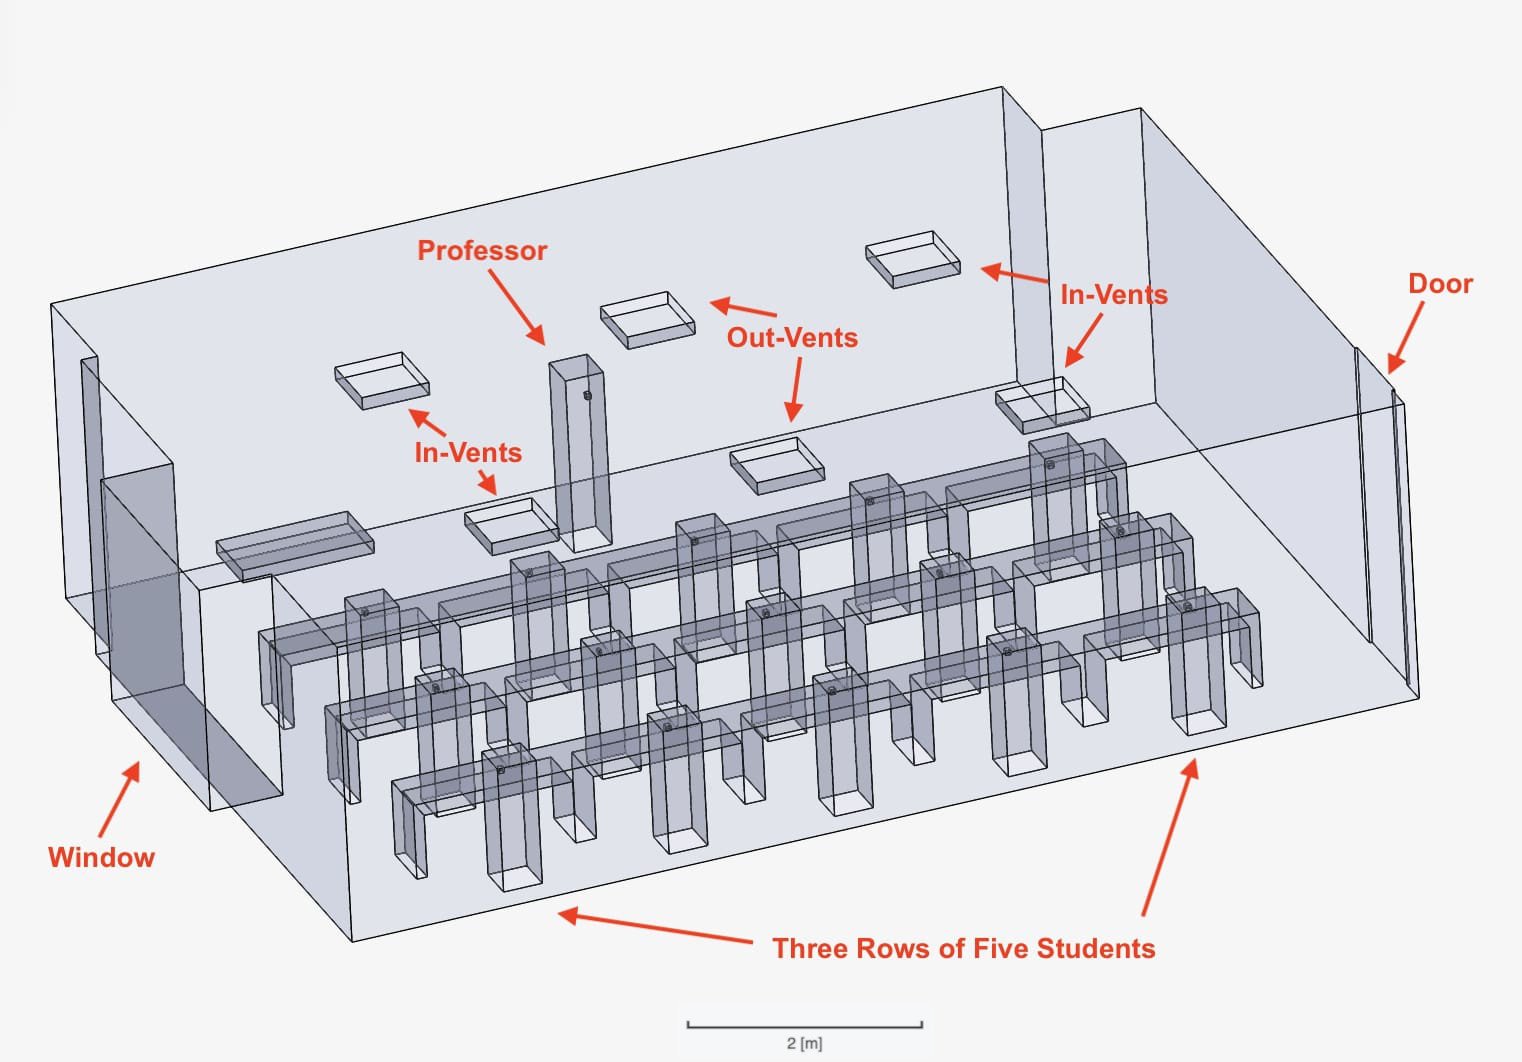
Figure 1. The students are approximately 1 m apart from each other. Their height relative to the professor and the room is approximated as a sitting position. The “In-Vents” deliver air into the room and the “Out-Vents” propel air out of the room.
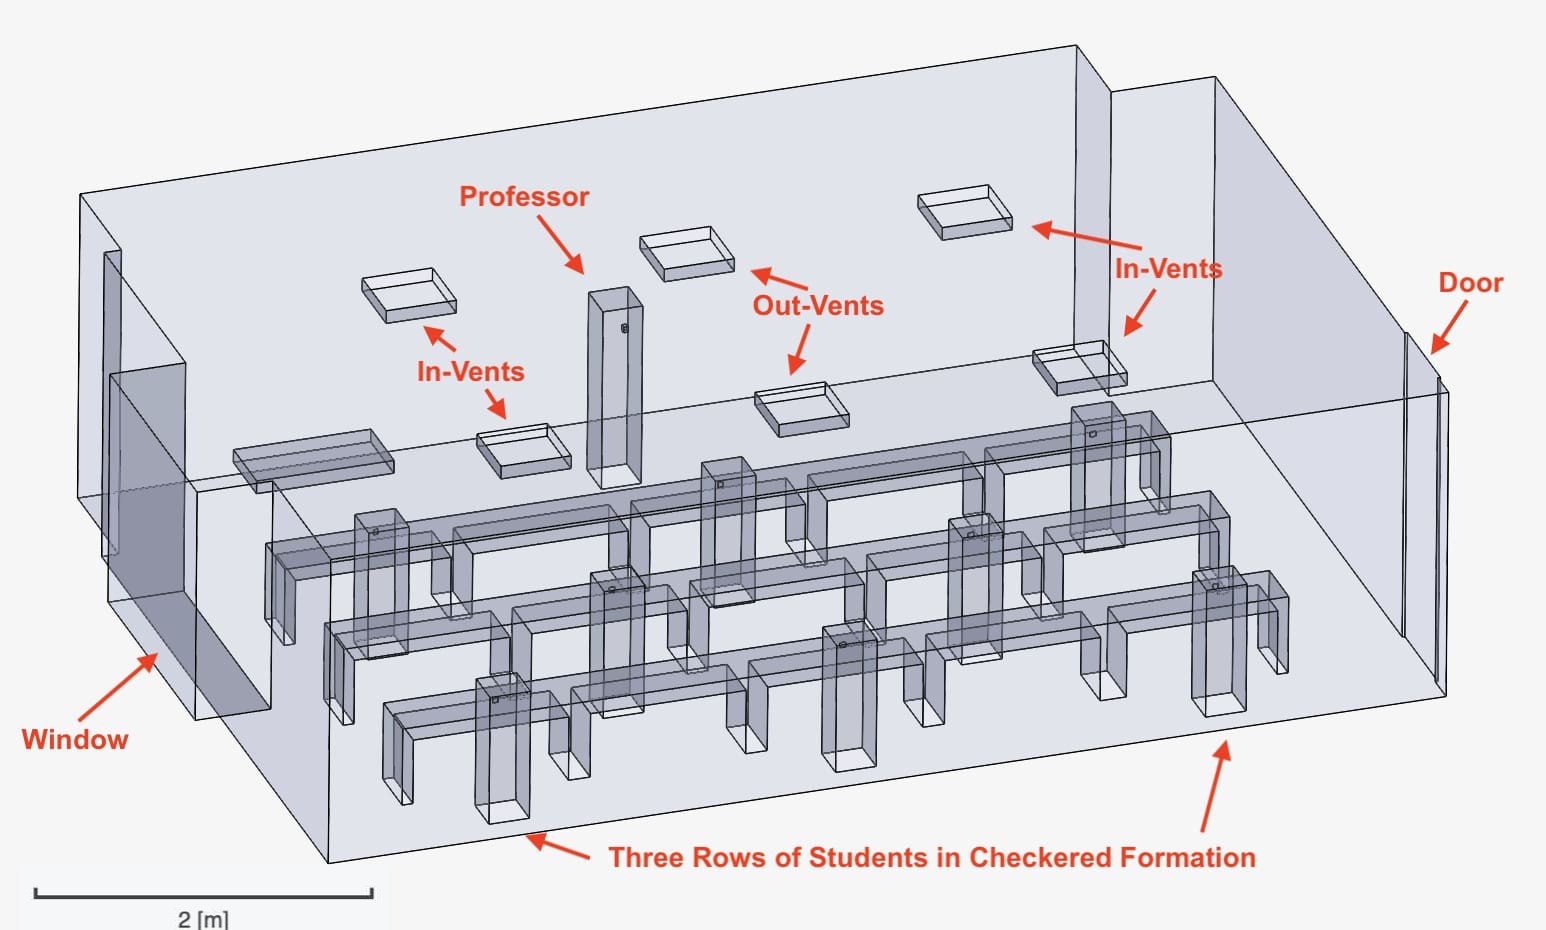
Figure 2. The students are arranged in a staggered position with seven total students approximately 1.5 to 2 m apart. This setup is identical to the full room in Figure 1 but with students removed from every other desk space. Their height relative to the professor and the room is approximated as a sitting position.
Two model APs were then separately placed into a full room, one with directed flow and one with radial flow, both of which were modeled off an aggregate of commonly sold APs on the market. The directed-flow AP features an inlet and outlet that are antiparallel. Thus, the overall flow is directed in a single direction. The modeled AP is 0.3 m in length and width and 0.5 m in height, with a rectangular inlet and outlet area of (0.07 x 0.2) m2 which is 0.4 m from the ground (Figure 3). The radial-flow AP takes in air from all directions and expels clean air vertically upwards. It has a radius of 0.2 m with a height of 0.5 m and an inlet zone wrapping radially around the bottom with a height of 0.3 m (Figure 4). Both types of APs were tested separately in three scenarios, and expels clean air vertically upwards. It has a radius of 0.2 m with a height of 0.5 m and an inlet zone wrapping radially around the bottom with a height of 0.3 m (Figure 4). Both types of APs were tested separately in three scenarios where they were placed in three different orientations. For the directed-flow AP, this comprised in the corner (scenario 6), in the middle of the room facing the z-axis (scenario 7) and in the middle facing the x-axis (scenario 8) (Figures 3, 5, 6). For the radial-flow AP, this comprised in the right corner (scenario 9), in the left corner (scenario 10) and in the middle (scenario 11) of the room (Figures 4, 7, 8).
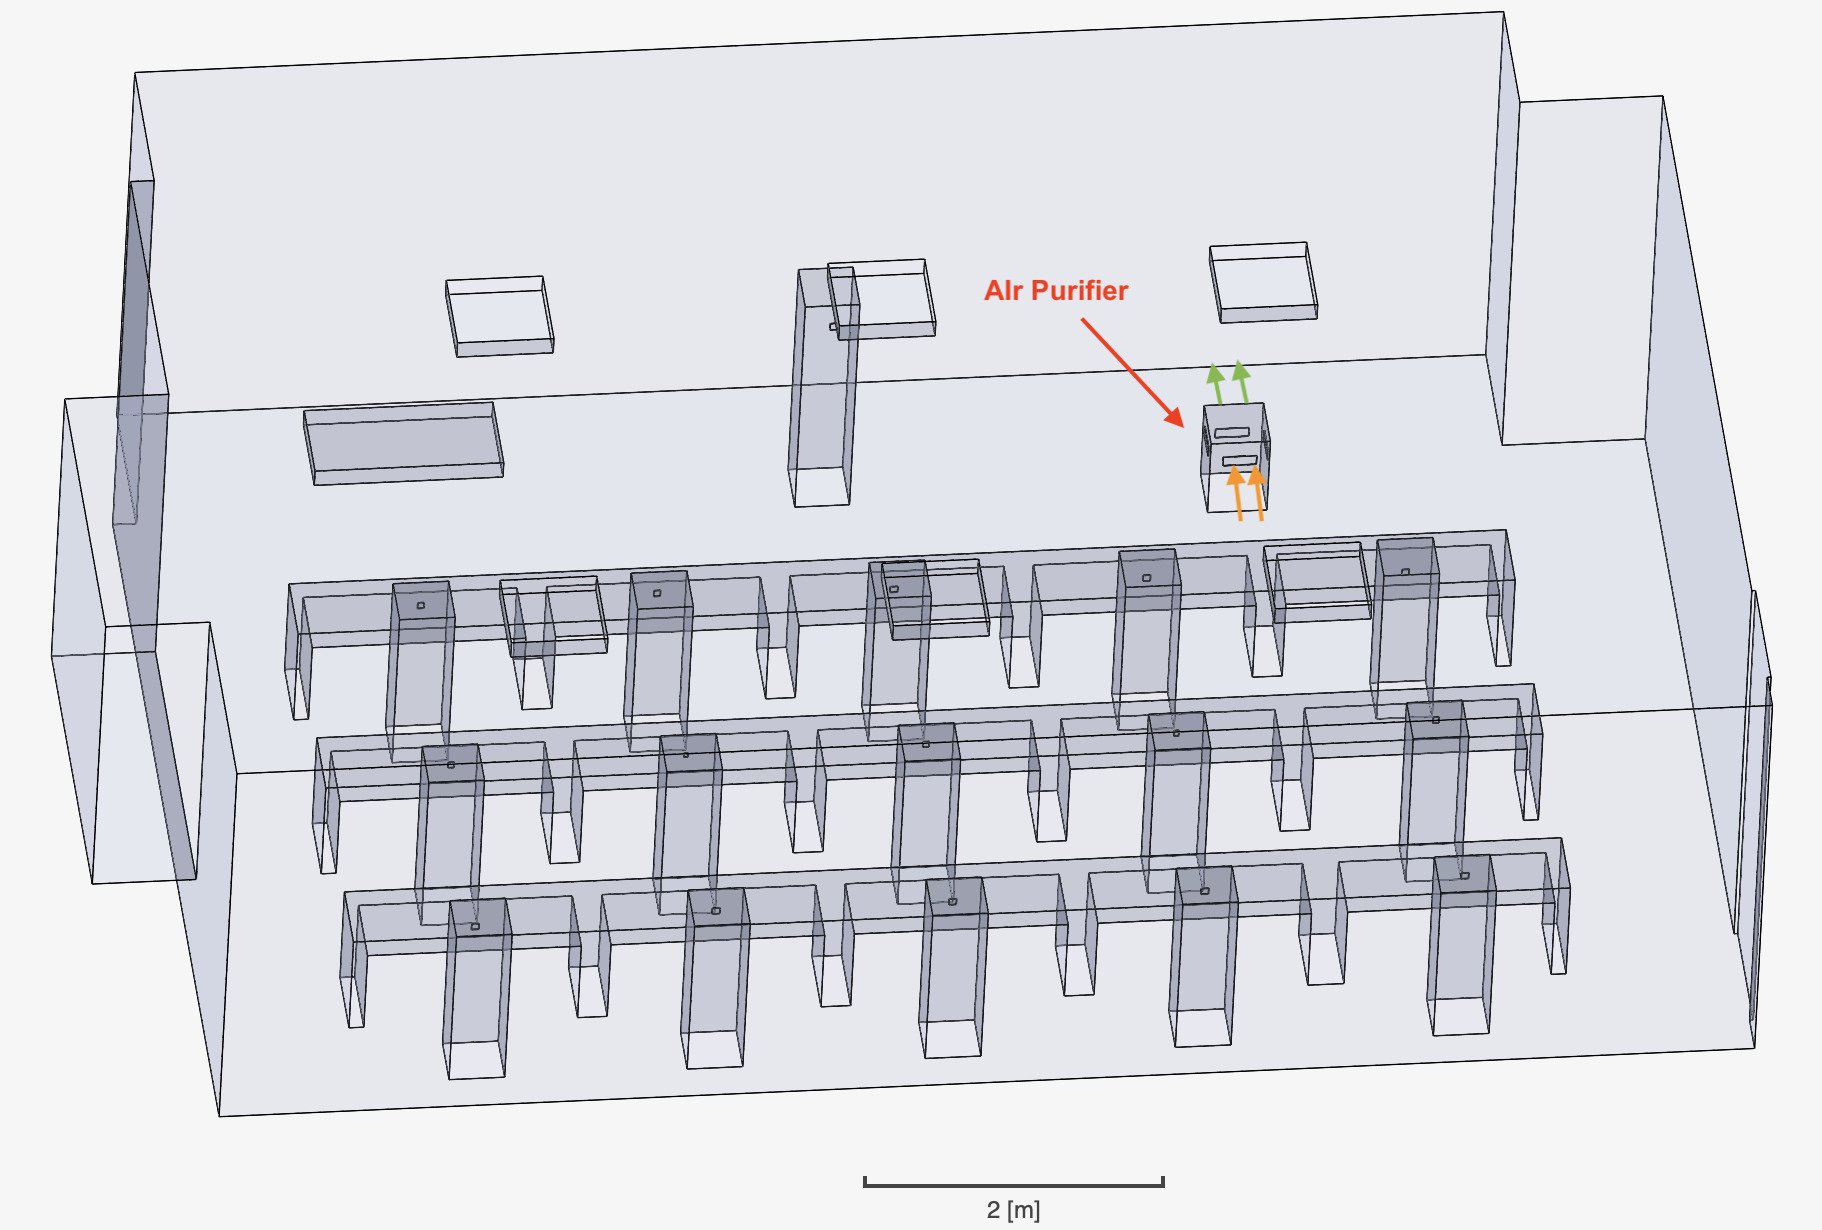
Figure 3. The box-shaped AP features directed flow, meaning the air enters and exits along the same direction. The green arrows represent the region where air enters the purifier and the orange arrows represents the direction with which it exits.
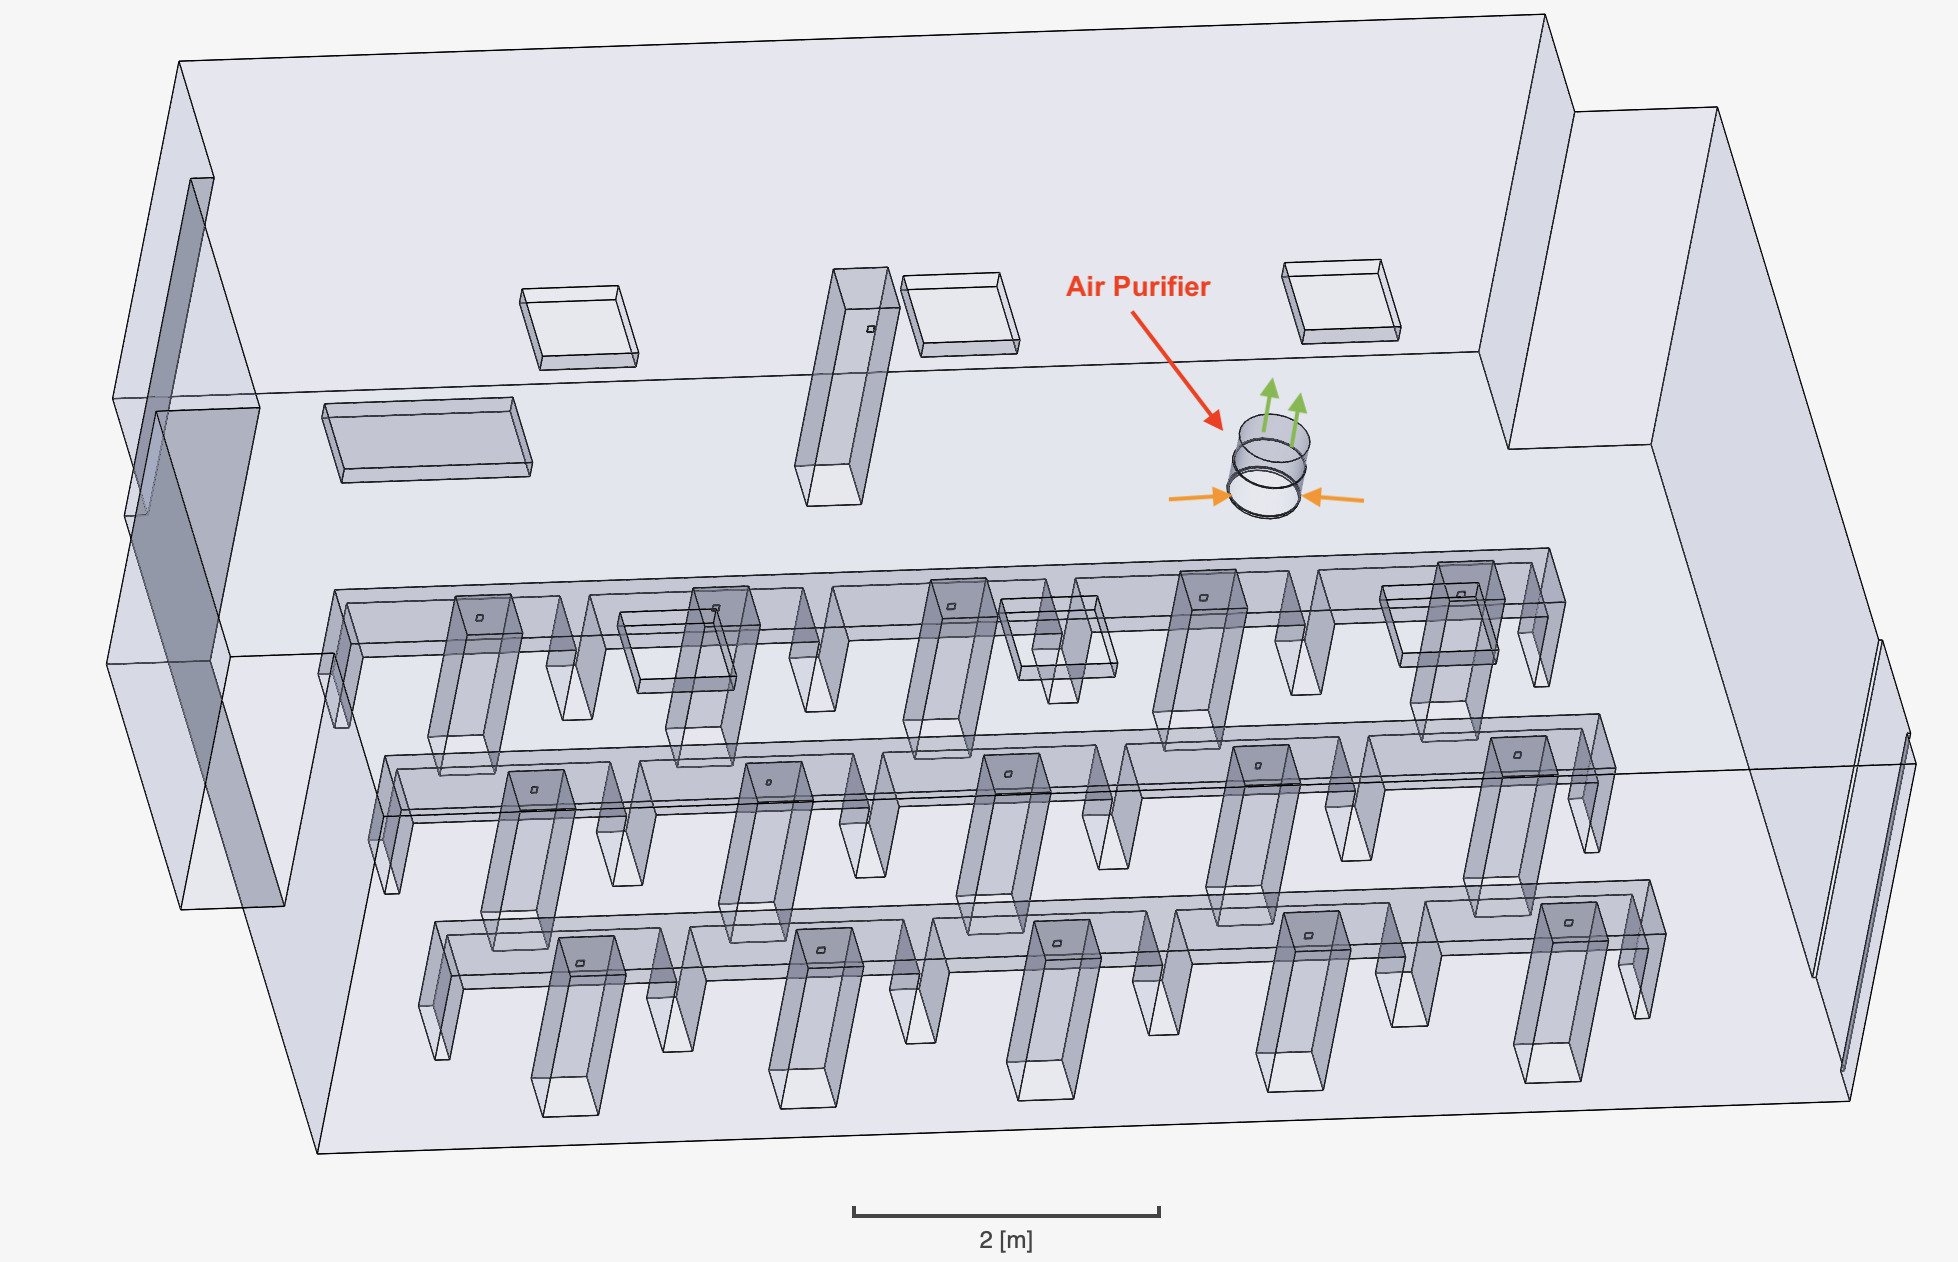
Figure 4. The circular AP features radial flow, meaning the air is taken in from all directions perpendicular to the side of the AP and expelled upwards. The green arrows represent the region where air enters the purifier and the orange arrows represents the direction with which it exits.

Figure 5. The arrangement is the same as that of the full room described in Figure 1 and the box-shaped AP is the same as described in Figure 3. However, the AP is now moved to the middle of the room in between students’ desks and turned to align with the z-axis.

Figure 6. The arrangement is the same as that of the full room described in Figure 1 and the box-shaped AP is the same as described in Figure 3. However, the AP is now moved to the middle of the room in between students’ desks and turned to align with the x-axis.
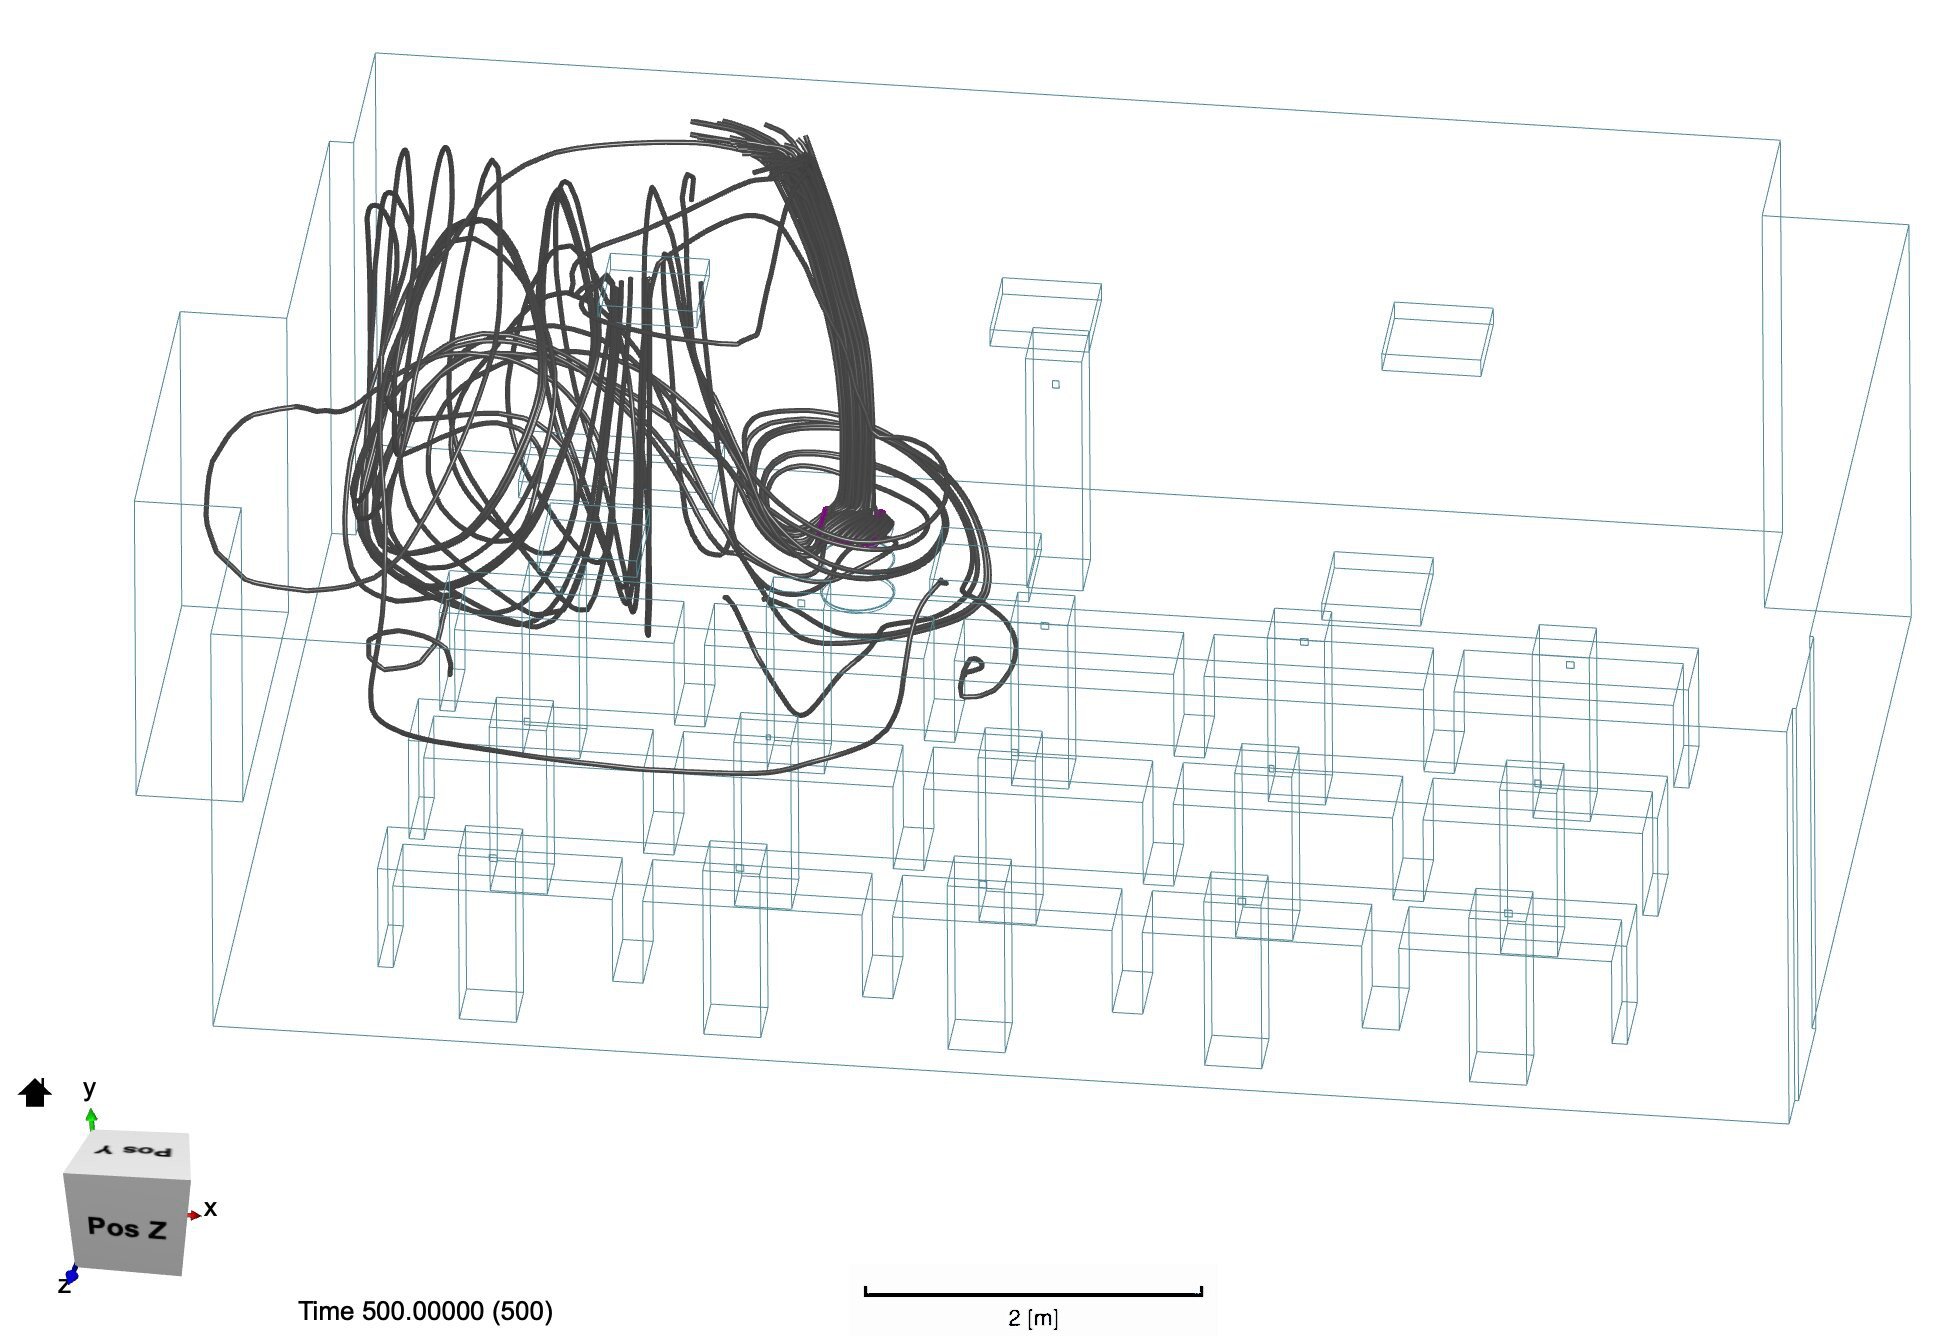
Figure 7. The dark grey particle tracer lines depict the flow pattern of the filtered air after it exits the air purifier. We see that the clean air ejects from the top of the AP and flows more sporadically throughout the room, concentrating in the region adjacent to the left of the AP.
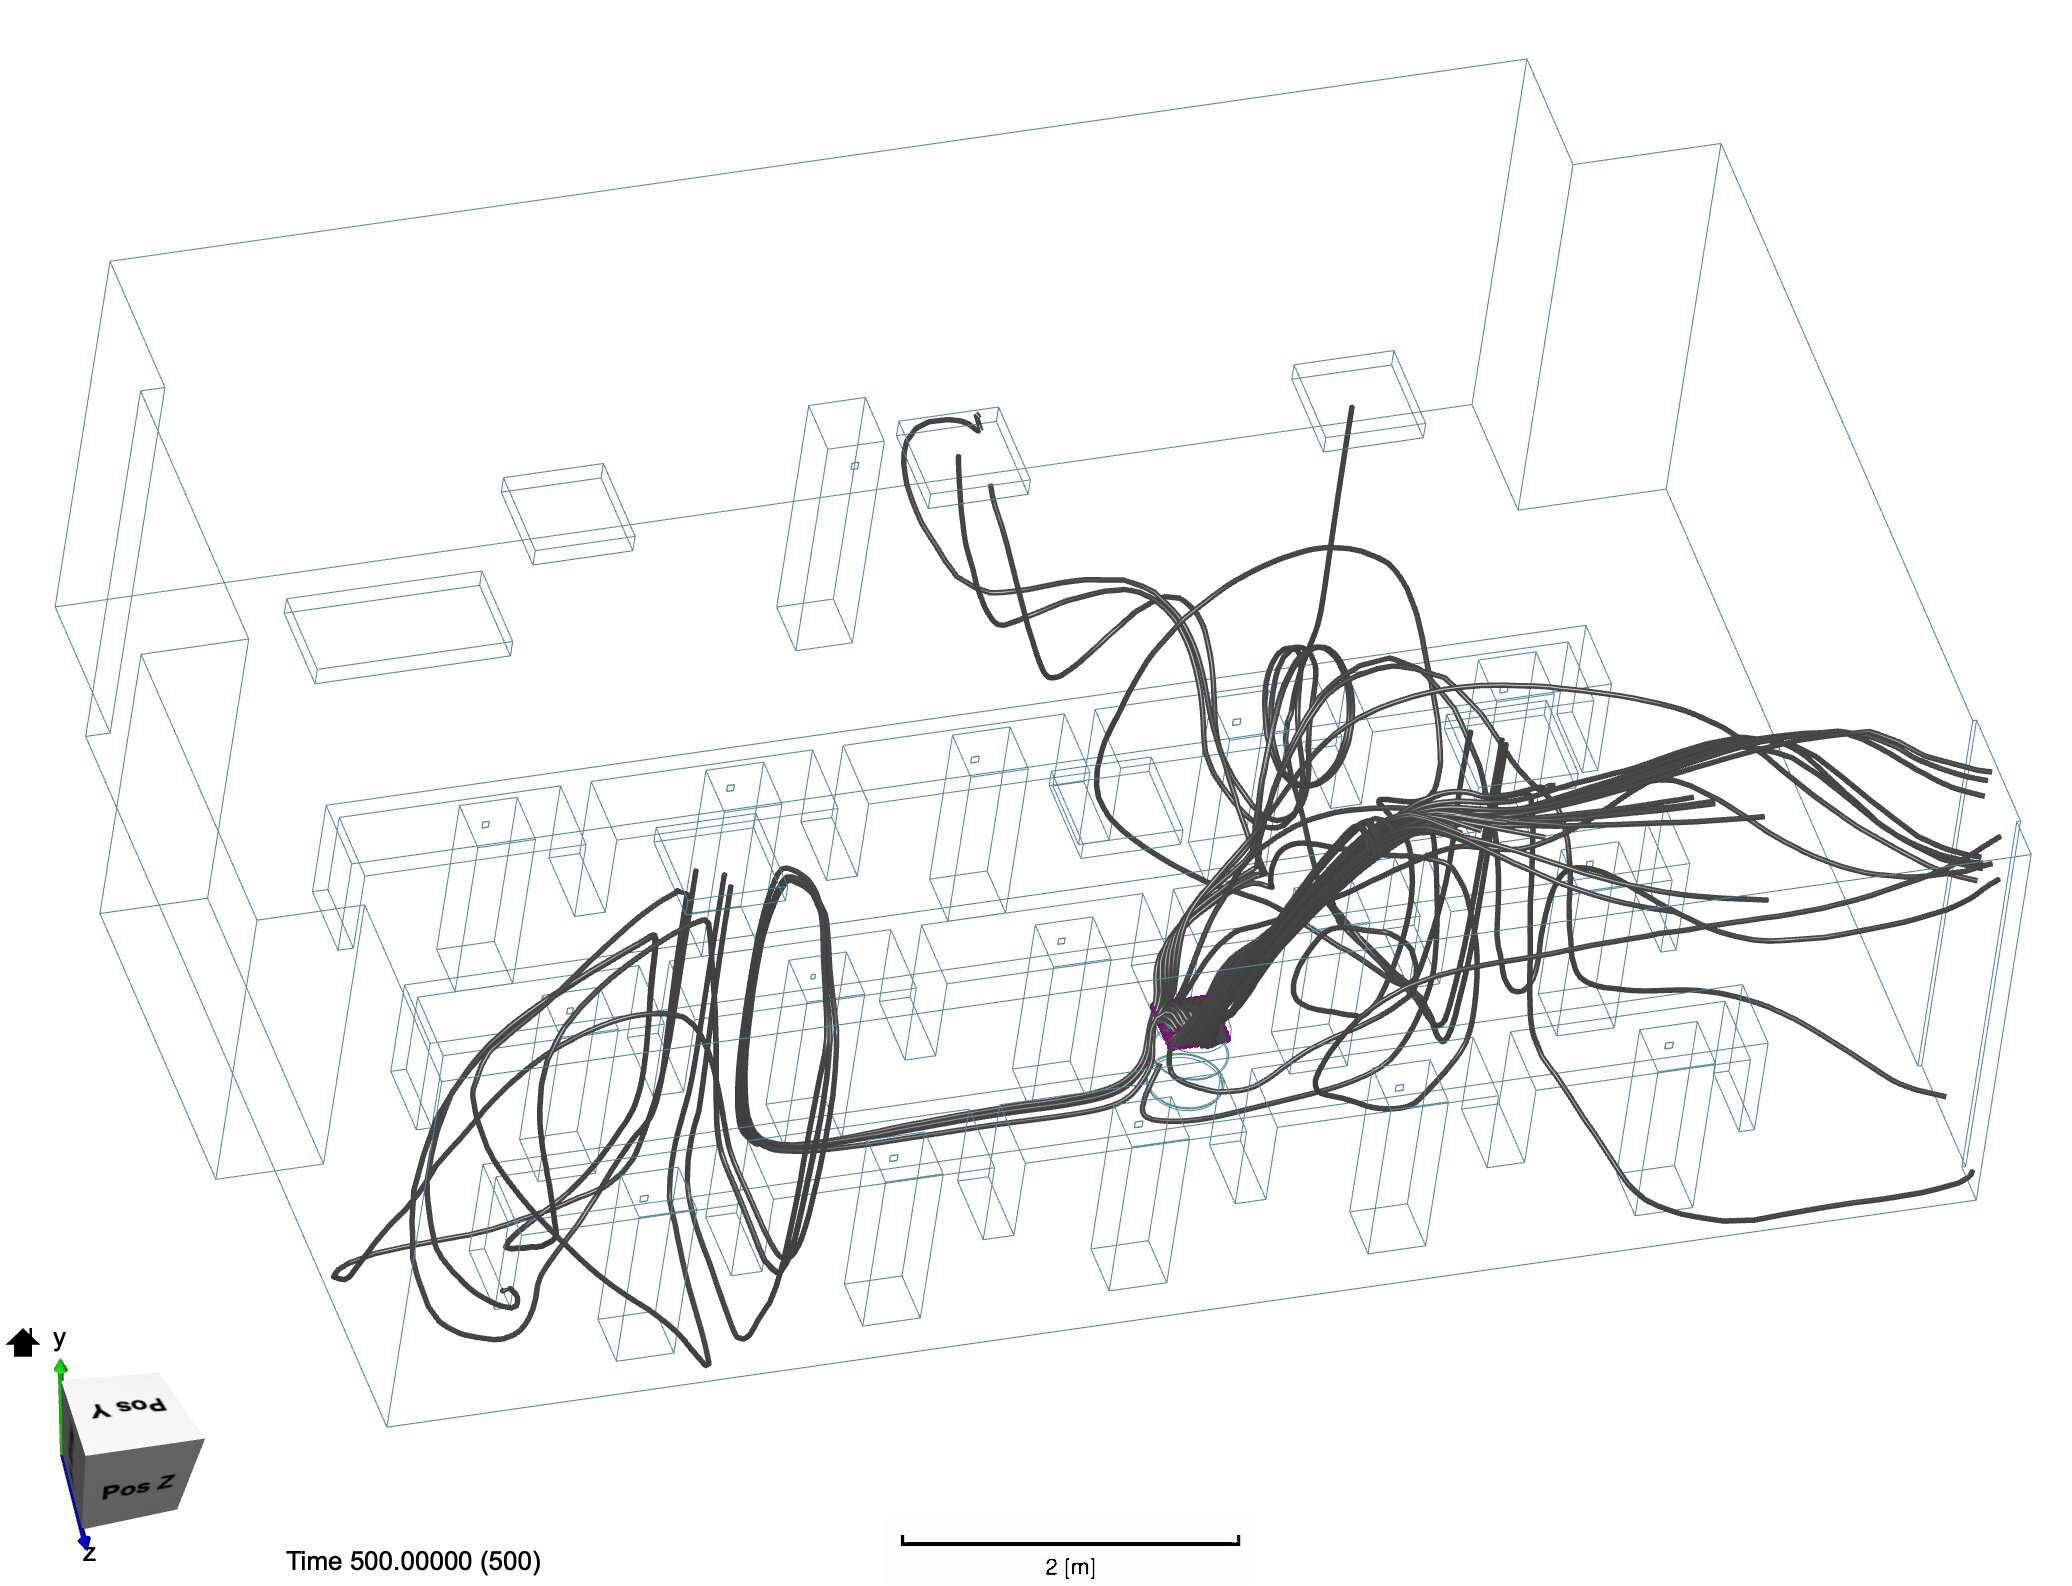
Figure 8. The dark grey particle tracer lines depict the flow pattern of the filtered air after it exits the air purifier. The same AP from Figure 25 is moved to another location. Air disperses in multiple directions, mostly running parallel to the desks between which the AP is placed.
The lecture hall has dimensions of 18.3m in length, 26 m in width (diameter of the semicircle) and 6.1 m in height, with 53 students sitting at half capacity and a professor at the front of the room. Dimensions of the people are the same as those in the mid-sized classroom. The students are spaced about 1.8 m apart within each row and 1.2 m apart between rows, each occupying a desk space among desks in a semicircle formation (scenario 12). The reconstructed student measurements remained the same as in the mid- sized classroom scenarios. The room features inlet vents at the back of the room curving along the wall and outlet vents at the front of the room (Figure 9). A second layout (scenario 13) was analyzed where individuals were seated in a ring formation at decreased capacity, but all other factors remained identical (Figure 10).
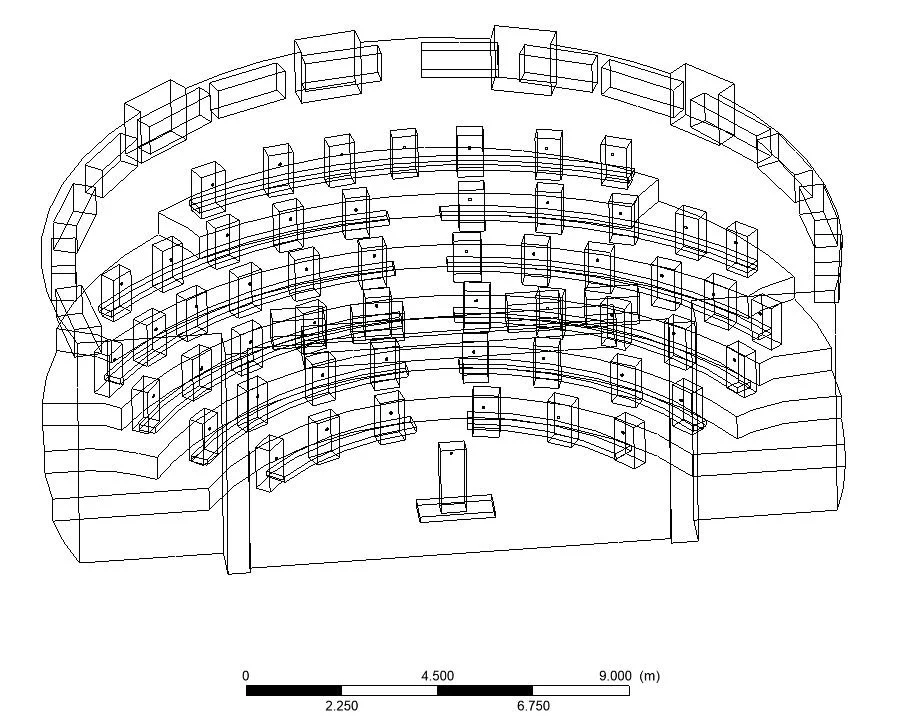
Figure 9. Simplified model of a semicircular auditorium in a tiered structure with differing elevations. Students and a professor in the front of the classroom are approximated as blocks behind desks.

Figure 10. Airflow of the students’ exhalation after they are arranged in a concentric ring formation as depicted in Figure 33. We see that the vortices shown in Figure 31 are now resolved and air instead gathers more so at the front of the room where the outlets are located.
Fluid Dynamics Computation
Models of the mid-sized classroom and lecture hall were imported into a C++ based open-source toolbox and Ansys, respectively. The described scenarios (1 through 13) were analyzed for particle flow of the air exhaled by students and the professor, as well as the flow of air outputted by the APs when applicable.
The mid-sized classroom was modeled using Open- FOAM, an open-source C++ toolbox, through the online emulator SimScale. Turbulence was calculated using a k-omega SST model with a Reynolds-averaged Navier-Stokes (RANS) incompressible solver, which is commonly used in indoor air particle flow modeling scenarios (Inthavong, 2020; Tian et al., 2007). Exhalation from the individuals was set at a constant 1m/s and inflow and outflow from vents was set at 1m/s based on present literature (Tang et al., 2013). The mesh was constructed with an average of 2.9 million cells. Each of the 11 evaluated scenarios consumed an average of 10 core hours on 16 computer cores. The lecture hall was modeled using ANSYS Fluent 19.3. Turbulence was calculated using a laminar model with a RANS incompressible solver. Inflow from vents was set at 1m/s. The mesh was constructed with an average of 19 thousand cells. Different software and parameters were employed due to technology and software constraints between authors.
In both scenarios, particle flow was approximated as air flow at ambient temperature of 72◦F and body and exhalation temperatures of 98.6◦F. The equation of particle motion is given by Equation 1:

where vi is the velocity of the particle, m is the mass of the particle, Fdrag is the drag force between the air and the particle, Fg is the gravitational force and Fa represents the additional forces, including the Basset force and Saffman’s lift force. Pressure and virtual mass forces were neglected as the particles are sufficiently small, while Brownian forces were neglected as the particles are sufficiently large (Abuhegazy et al., 2020). Analysis of the particle flow behavior is purely qualitative and is coupled with diagrams illustrating the described behavior.
RESULTS
Original Research: Airflow Modeling in Classrooms
Mid-Sized Classroom
Scenarios 1, 2, and 3, examined the room at full capacity (15 students in a rectangular formation). In scenario 1, air particles tended to congregate along the walls and in the corners. More specifically, they tended to recirculate in the corners at the front of the room without cycling through the room efficiently. (Figures 11, 12). The particles followed a similar path in scenario 2, although there was a noticeable decrease in density on the door side of the room with the door open. (Figures 13, 14). In scenario 3, the particles were decondensed both on the door and window sides of the room, as both were open (Figures 15, 16).

Figure 11. The first of two angles of the same set of particle tracers. Each tracer color represents the exhalation from a different student. Not all students’ exhalation paths are shown. The exhalation naturally forms vortices that cycle in various corners of the room as depicted by the different tracer colors. Pockets of heavy cross contamination form as a result.
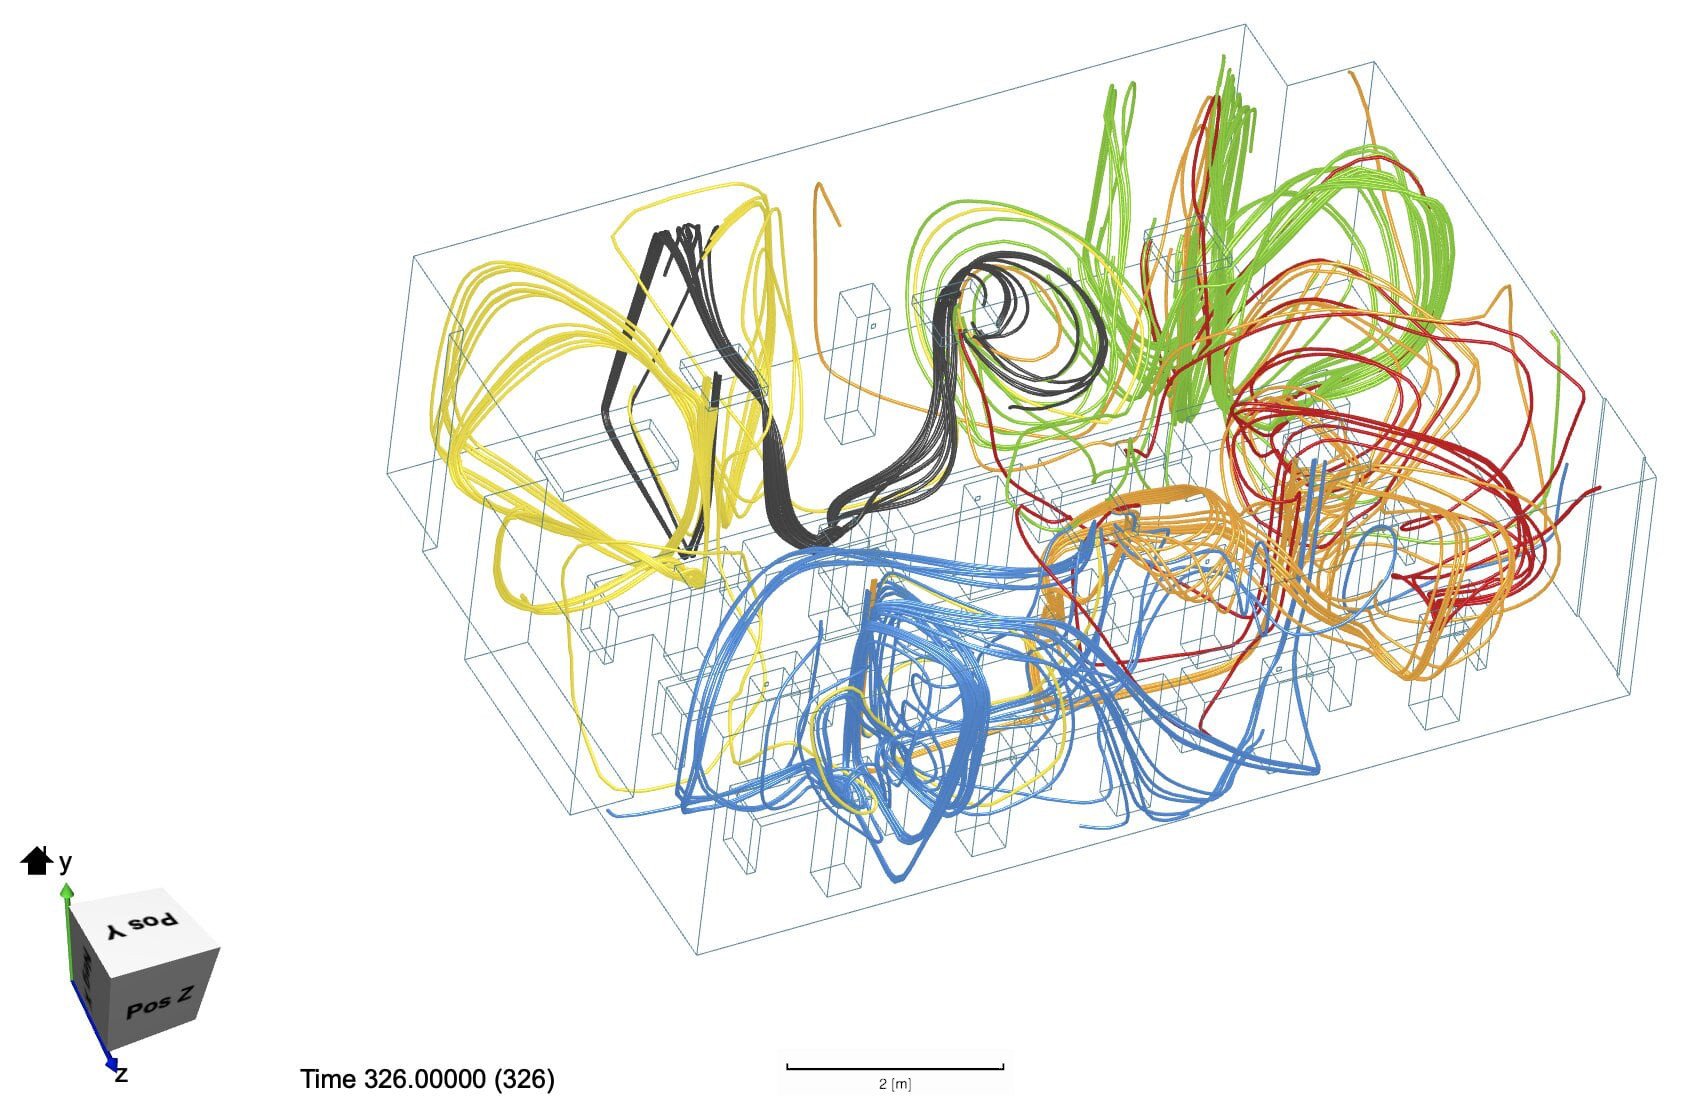
Figure 12. The second of two angles of the same set of particle tracers. See Figure 11 description for additional information.
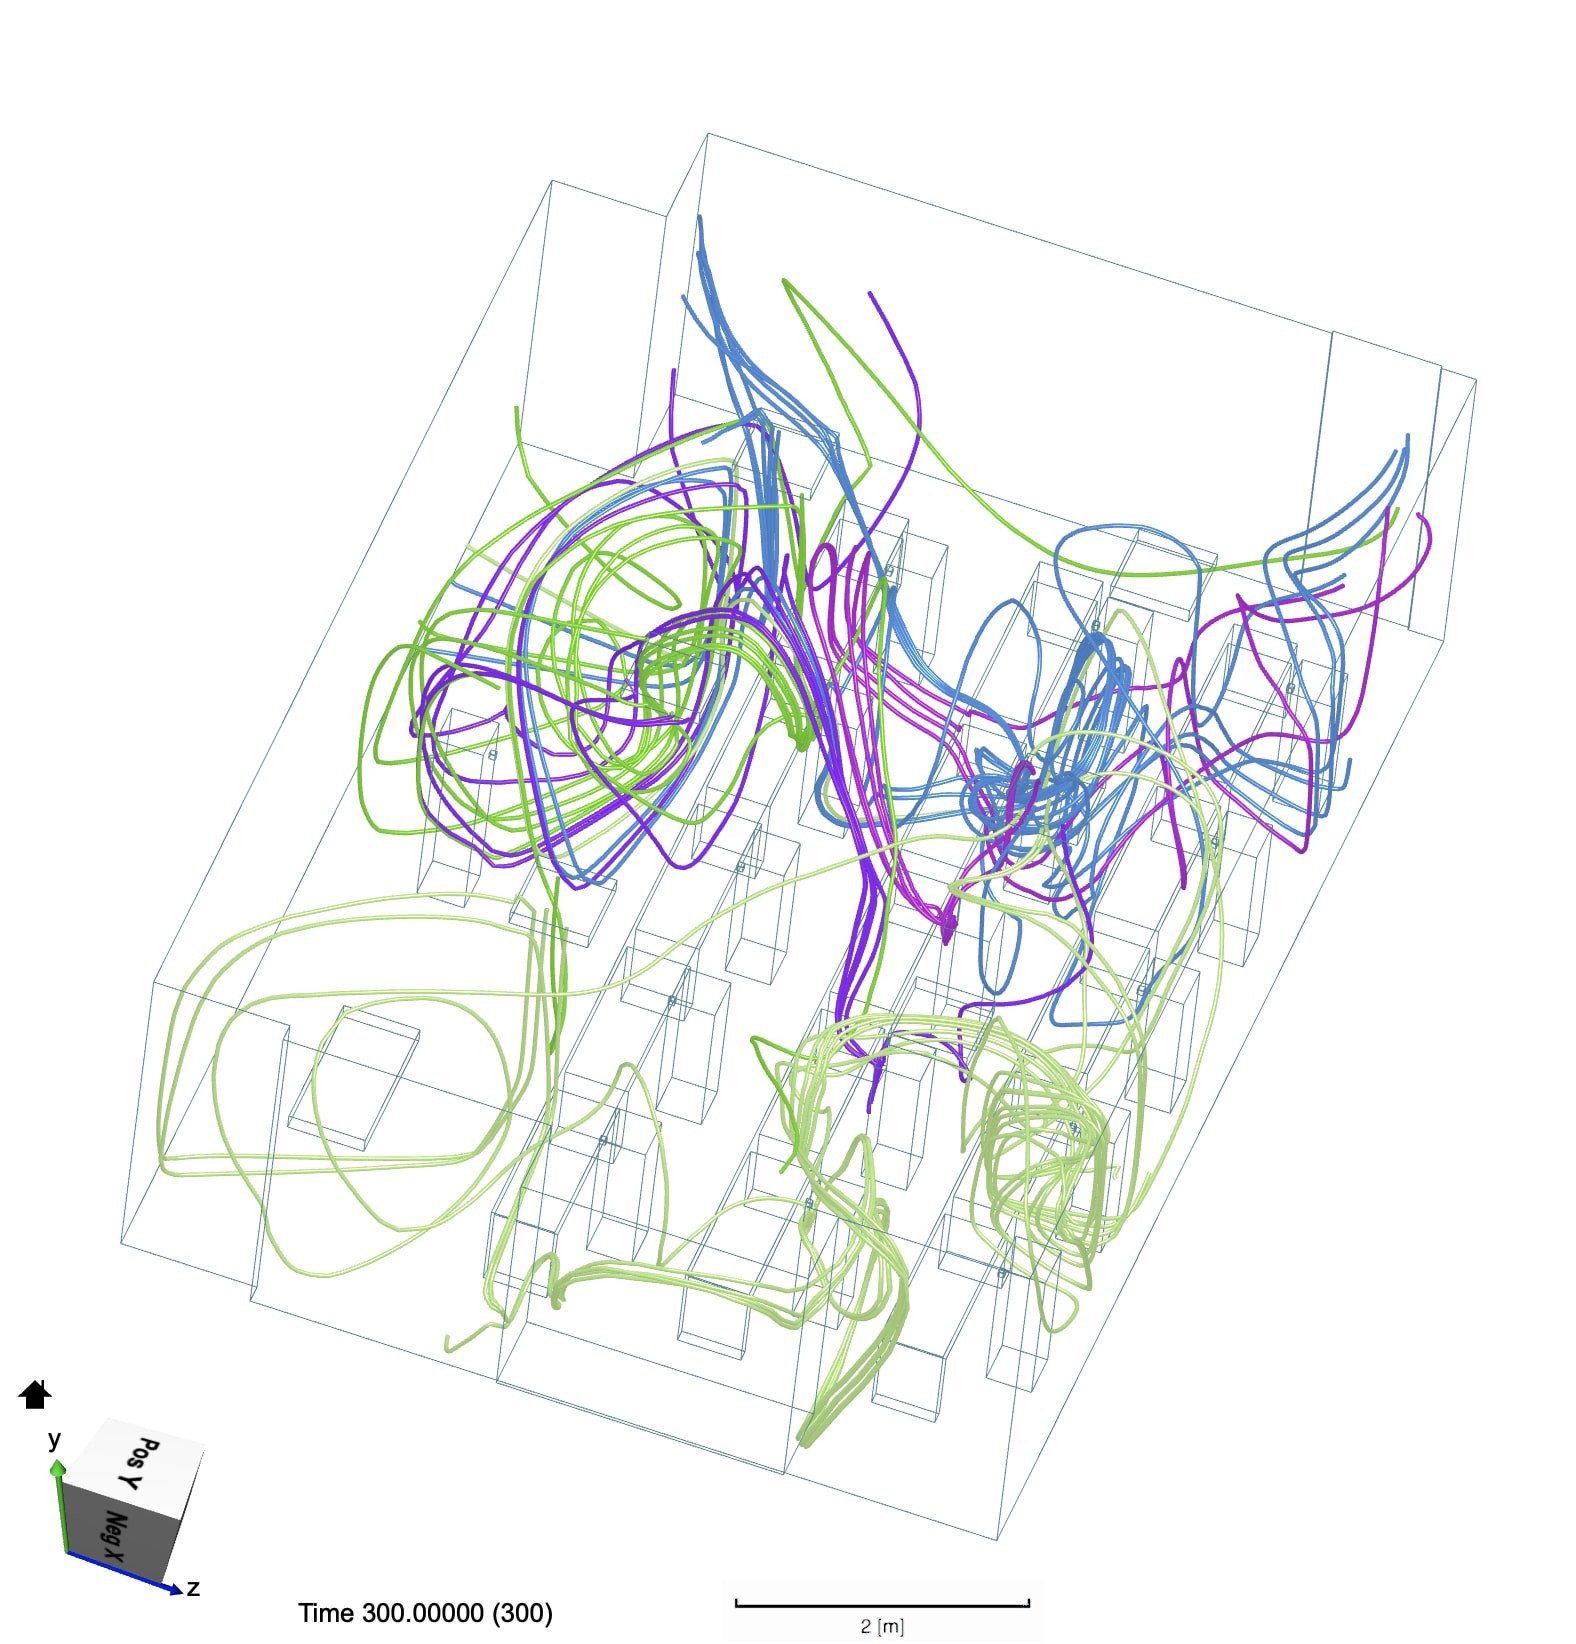
Figure 13. The first of two angles of the same set of particle tracers. Each tracer color represents the exhalation from a different student. Not all students’ exhalation paths are shown. We see that with the door open, air escapes from the right side of the room through the door. This reduces the concentration of exhalation on the right side of the room compared to Figures 32 and 33.
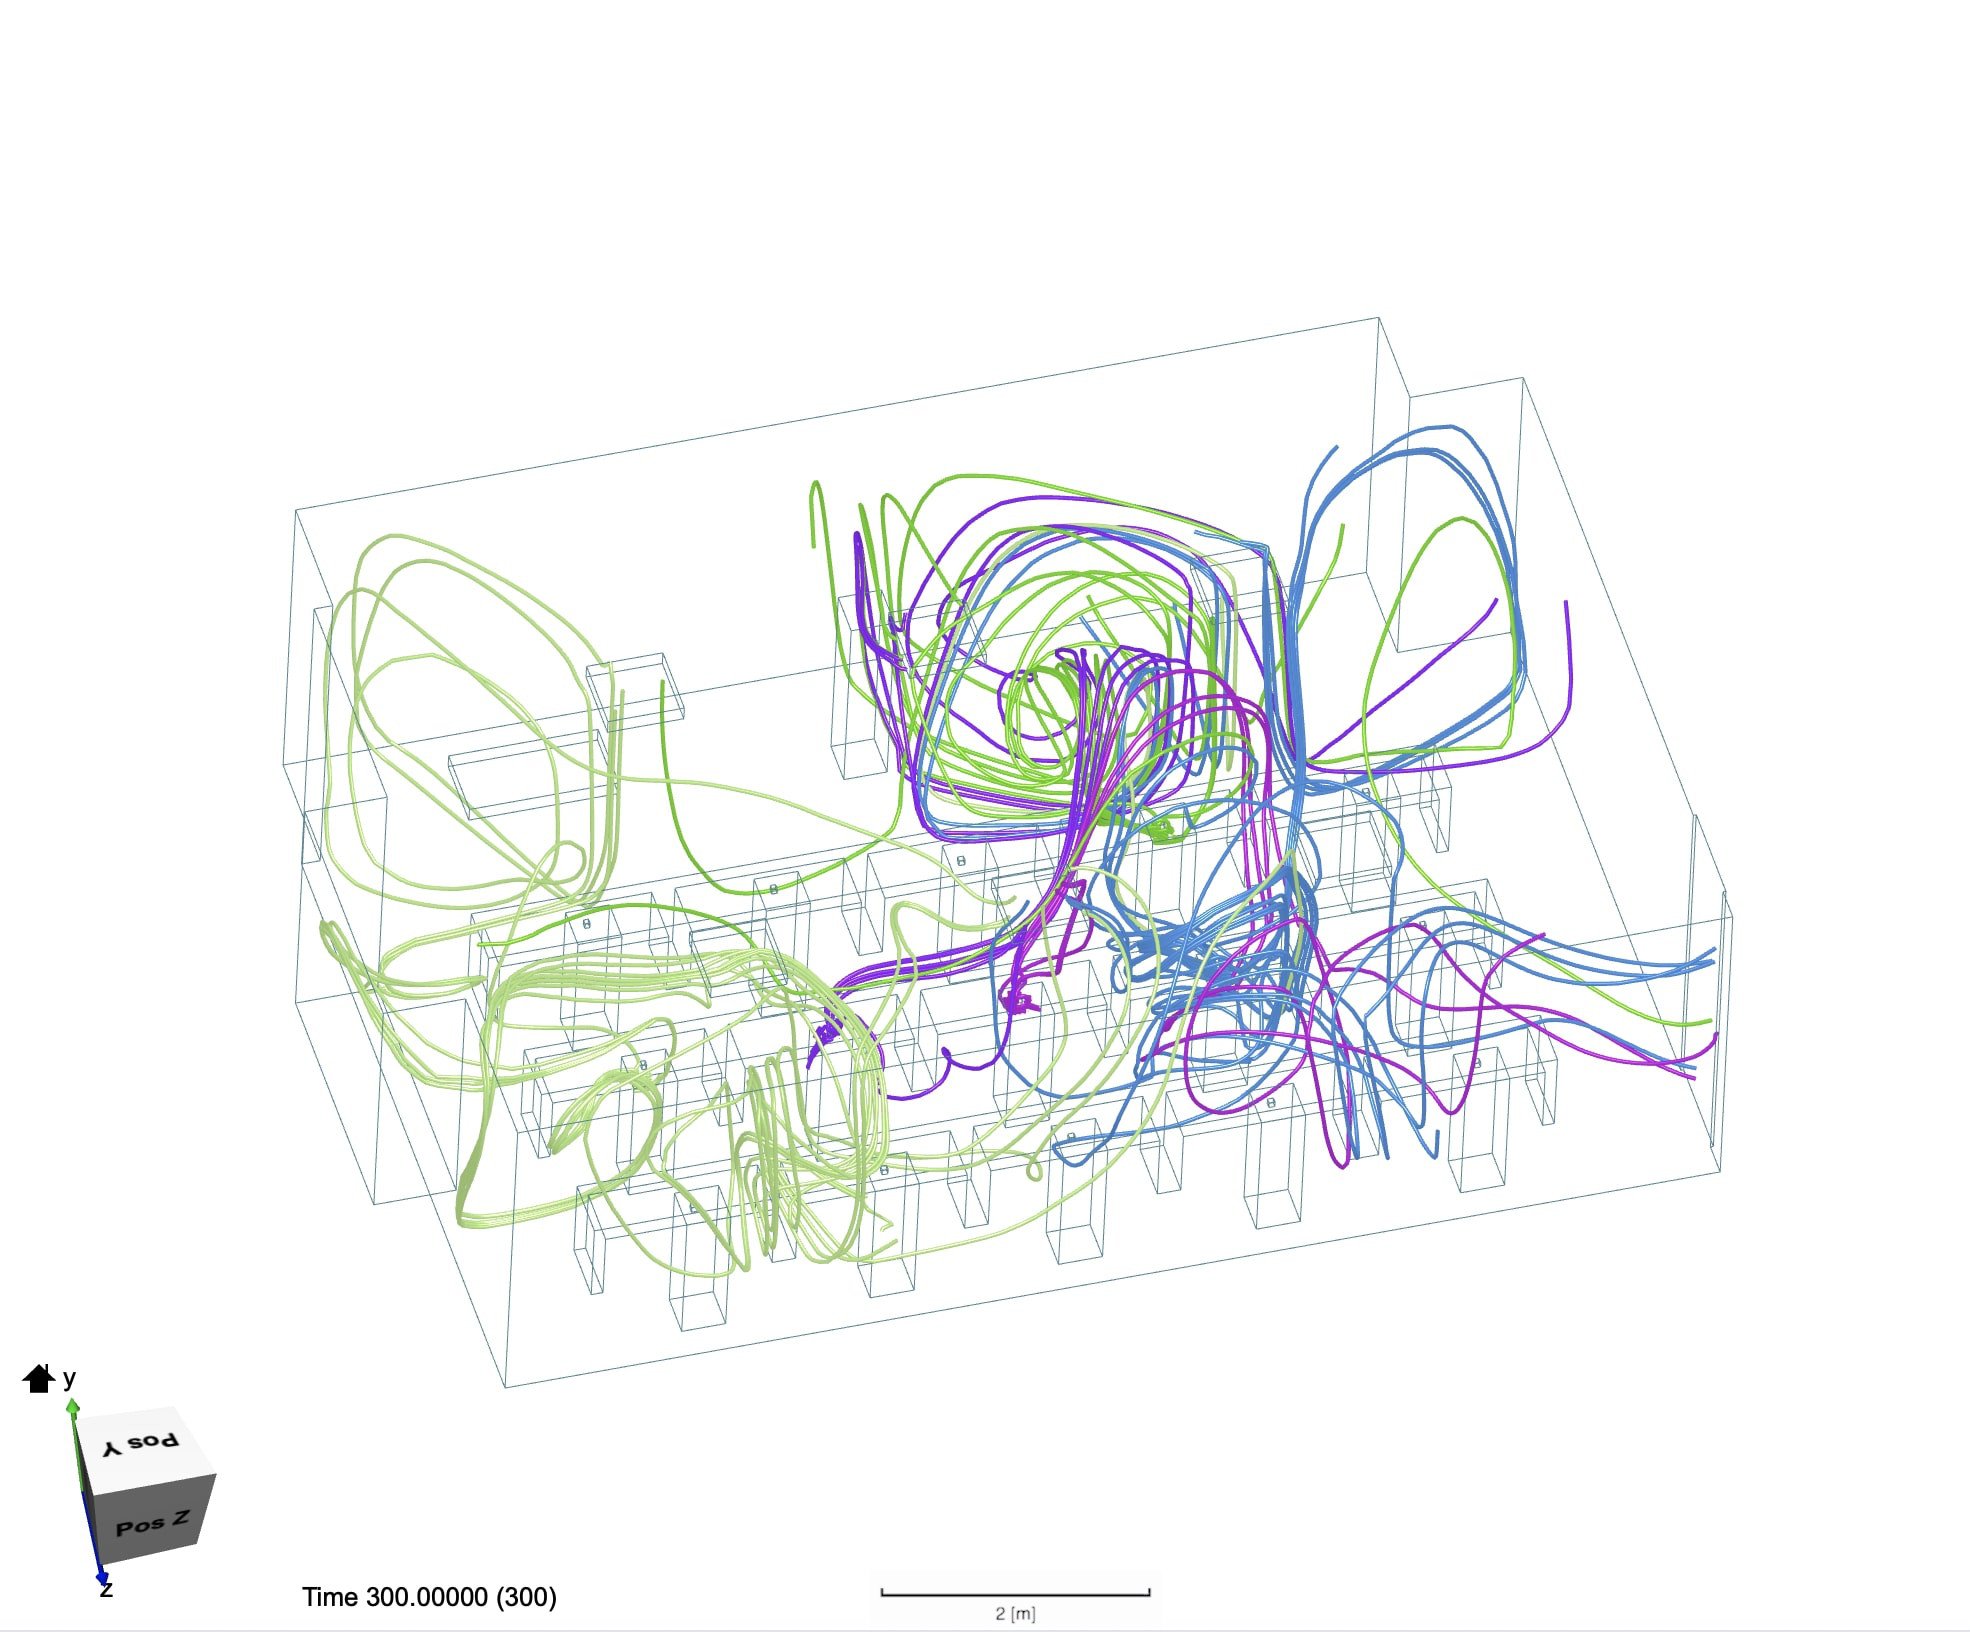
Figure 14. The second of two angles of the same set of particle tracers. See Figure 13 description for additional information.

Figure 15. The first of two angles of the same set of particle tracers. Each tracer color represents the exhalation from a different student. Not all students’ exhalation paths are shown. With the window and door open, we see air escaping both the right and left sides of the room. The concentration of exhalation noticeably decreases on the left side of the room compared to Figures 11 and 12.
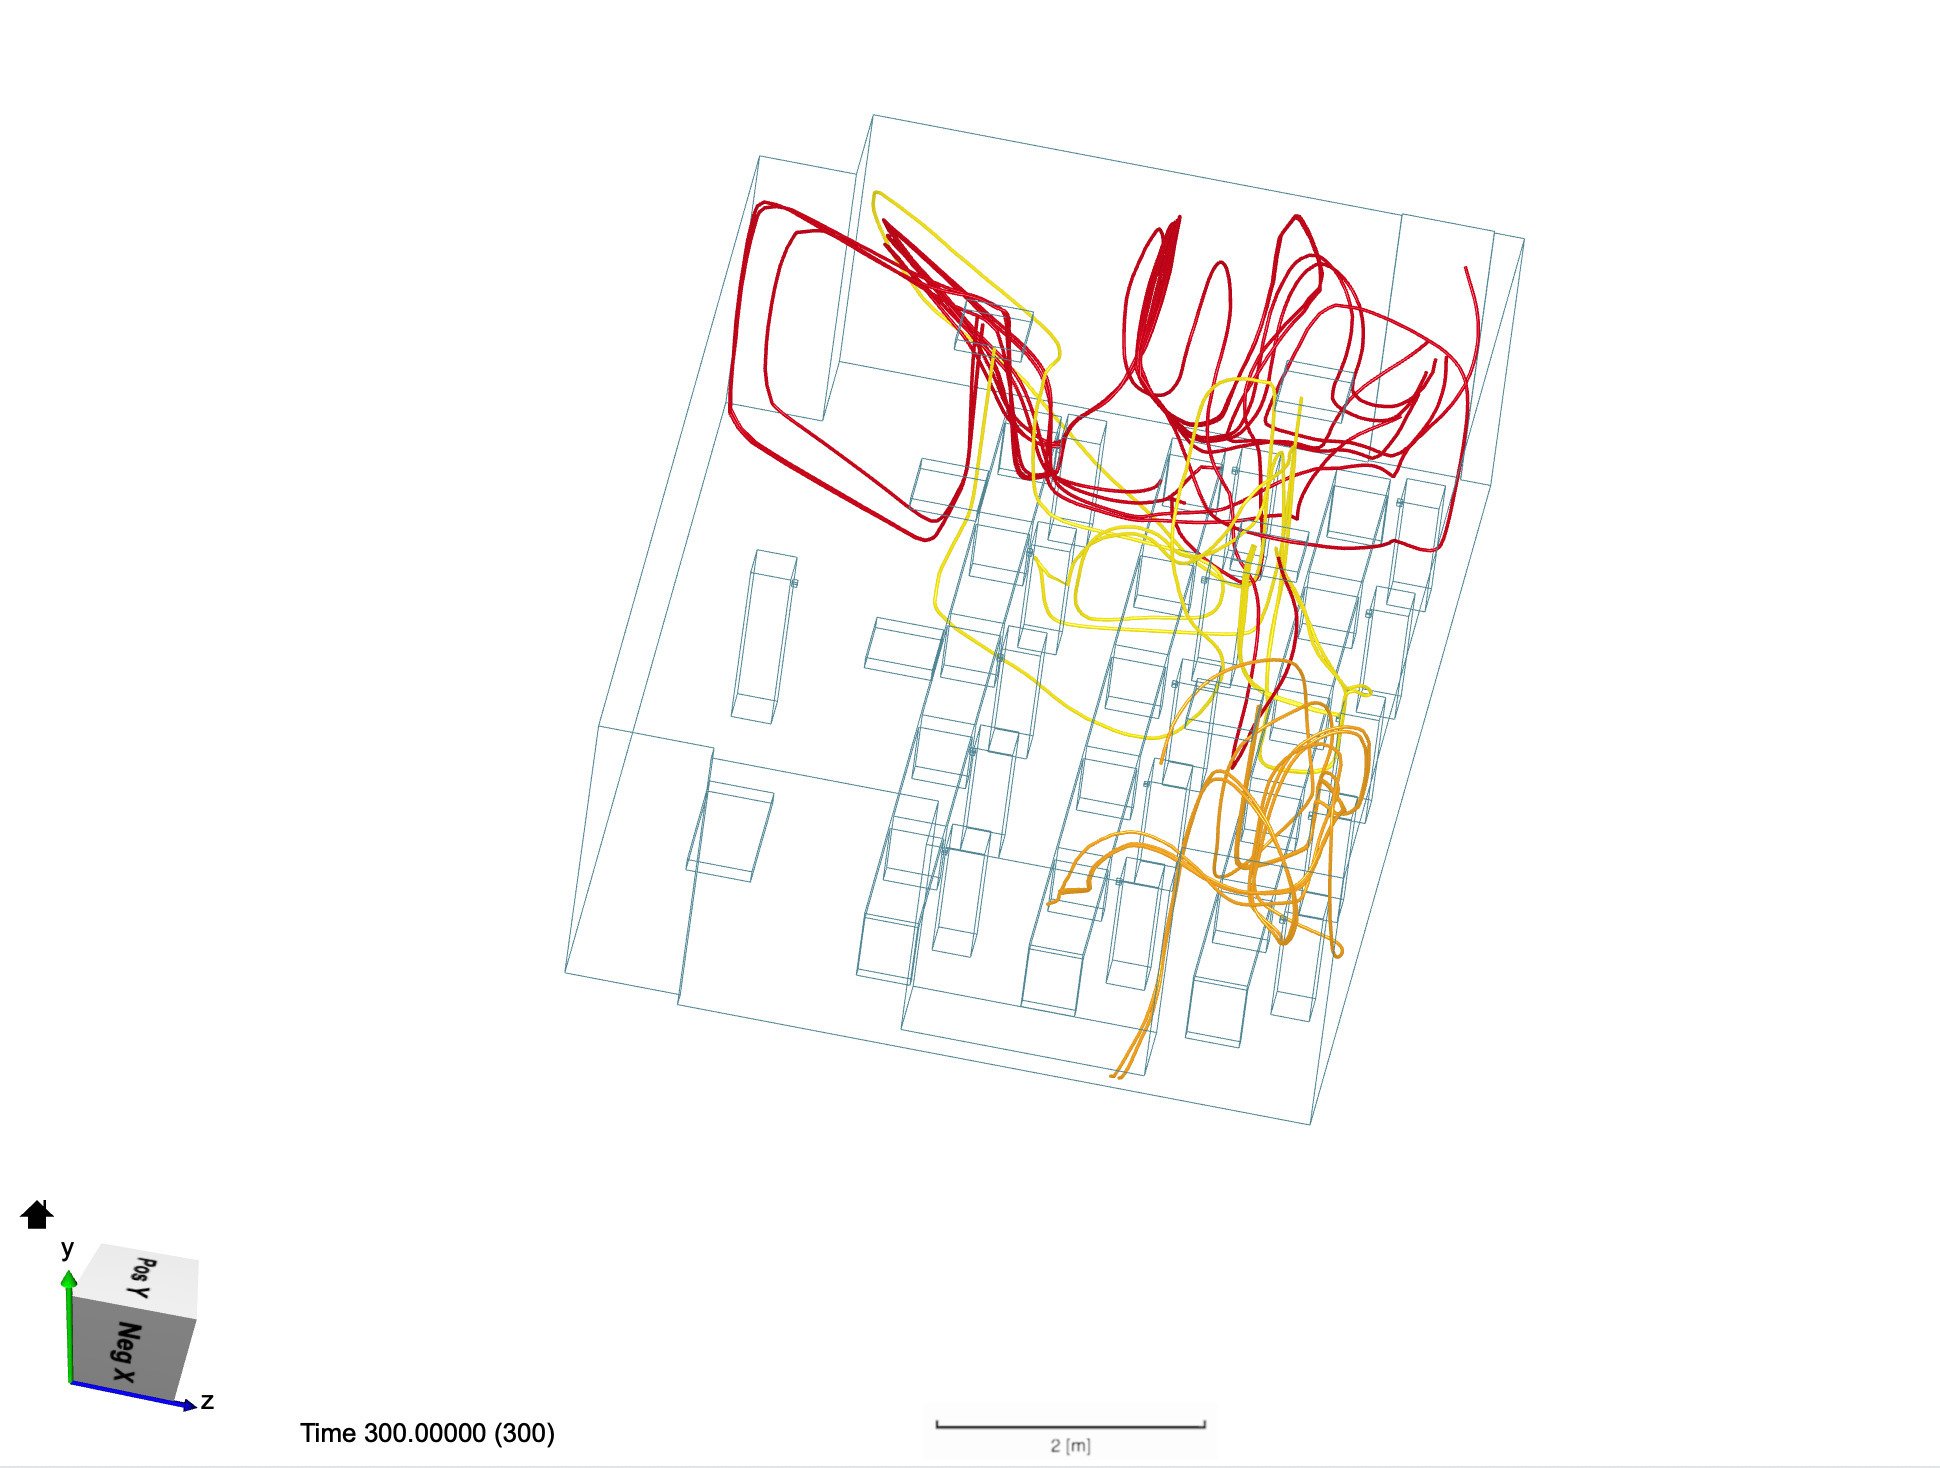
Figure 16. The second of two angles of the same set of particle tracers. See Figure 15 description for additional information.
Scenarios 4 and 5 examined the room with students in a staggered formation to increase distance between the students. With only the door open, the flow patterns were similar to that of scenario 2. In particular, particles recirculated on the left side of the room (Figure 17). With the window open, however, those air pockets circulated out into the environment. In addition, overlap between individual exhalation patterns greatly decreased (Figures 18, 19).

Figure 17. Each tracer color represents the exhalation from a different student. Not all students’ exhalation paths are shown. We see a similar pattern to Figures 13 and 14 where the concentration of particles on the right side of the room is considerably lower because of the open door, especially compared to the left side.

Figure 18. The first of two angles of the same set of particle tracers. Each tracer color represents the exhalation from a different student. Not all students’ exhalation paths are shown. Paying attention to the window and door segments of the room, we see considerable decrease in the exhalation concentration in both regions. As a result, we see that the orange, blue, and red tracers minimally overlap, which indicates that there is reduced air cross contamination.

Figure 19. The second of two angles of the same set of particle tracers. See Figure 18 description for more information.
Scenarios 6, 7, and 8 examined the inclusion of a directed-flow AP in a full classroom. In scenario 6, the AP was placed in the corner at the front of the room, with air exiting via the z-axis (Figure 3). The air expelled from the AP (assumed to be “clean”) followed a vortex flow pattern that circulated throughout the entire room, moving along the walls (Figure 20). The students’ exhaled particles largely followed the same pattern with higher density flow along the walls of the room (Figures 21, 22). In scenario 7, the AP was moved to the middle of the room and aligned with the z-axis (Figure 5). In scenario 8, the AP was rotated to align with the x-axis (Figure 6). In both cases, there was minimal clean air circulation with high particle density in the corners of the room. In scenario 7, a vortex could be seen forming on the left side of the room (Figures 23, 24).
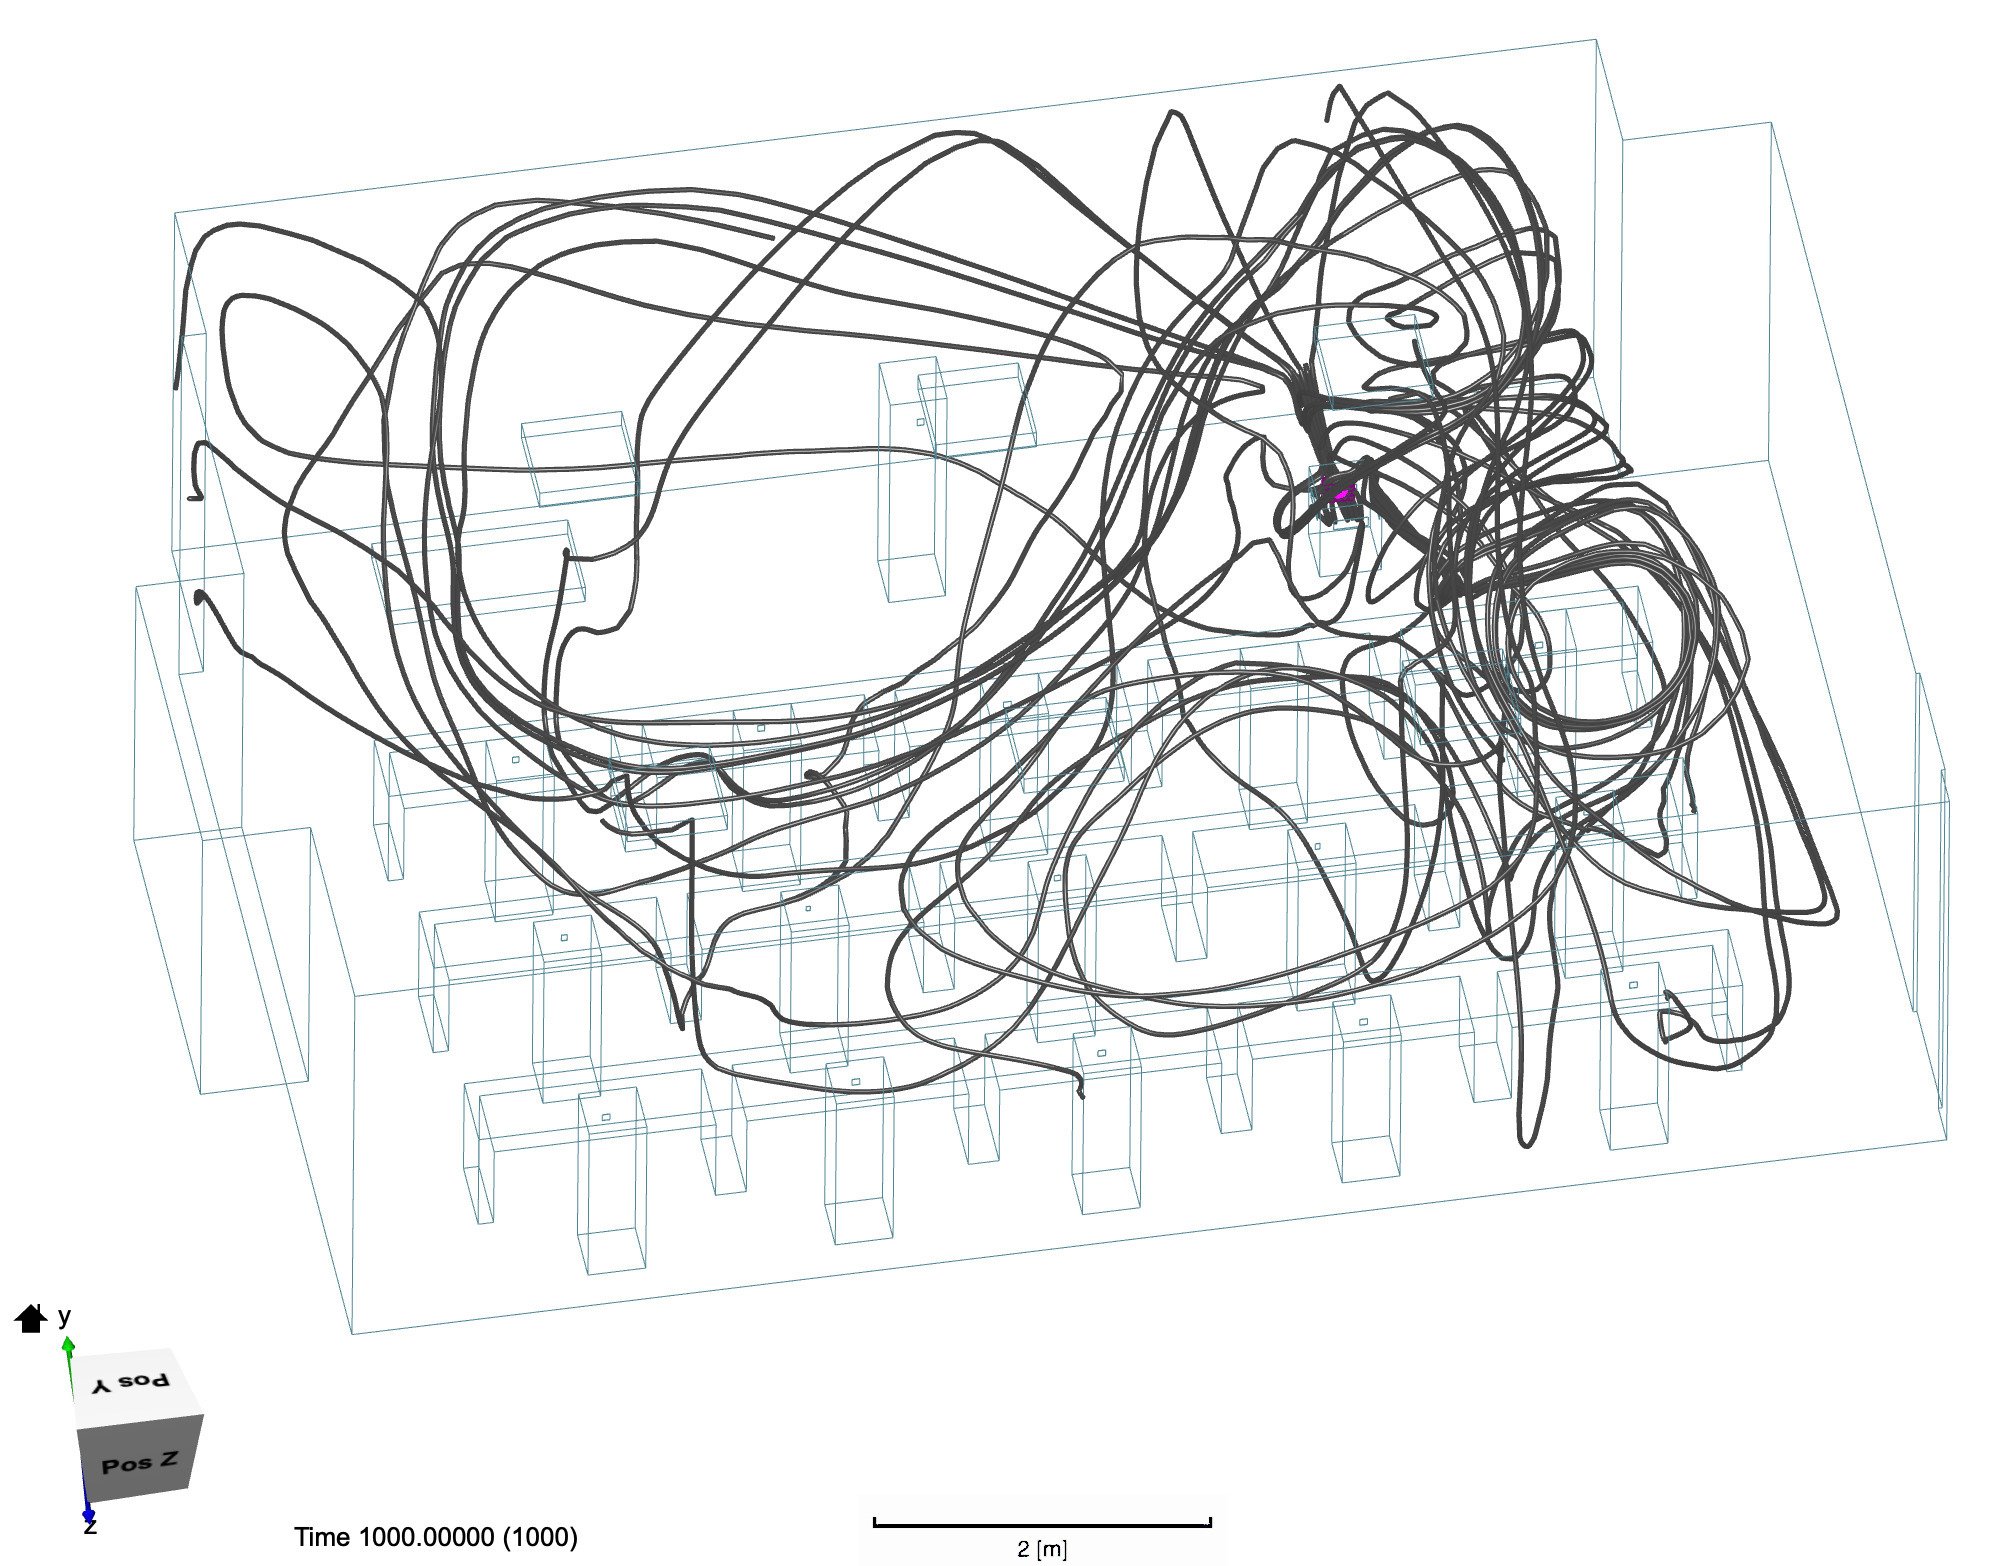
Figure 20. The dark gray particle tracer lines depict the flow pattern of the filtered air after it exits the AP. We see that the clear air moves around the room, covering the edges, and returns back to the AP in a large circular shape.
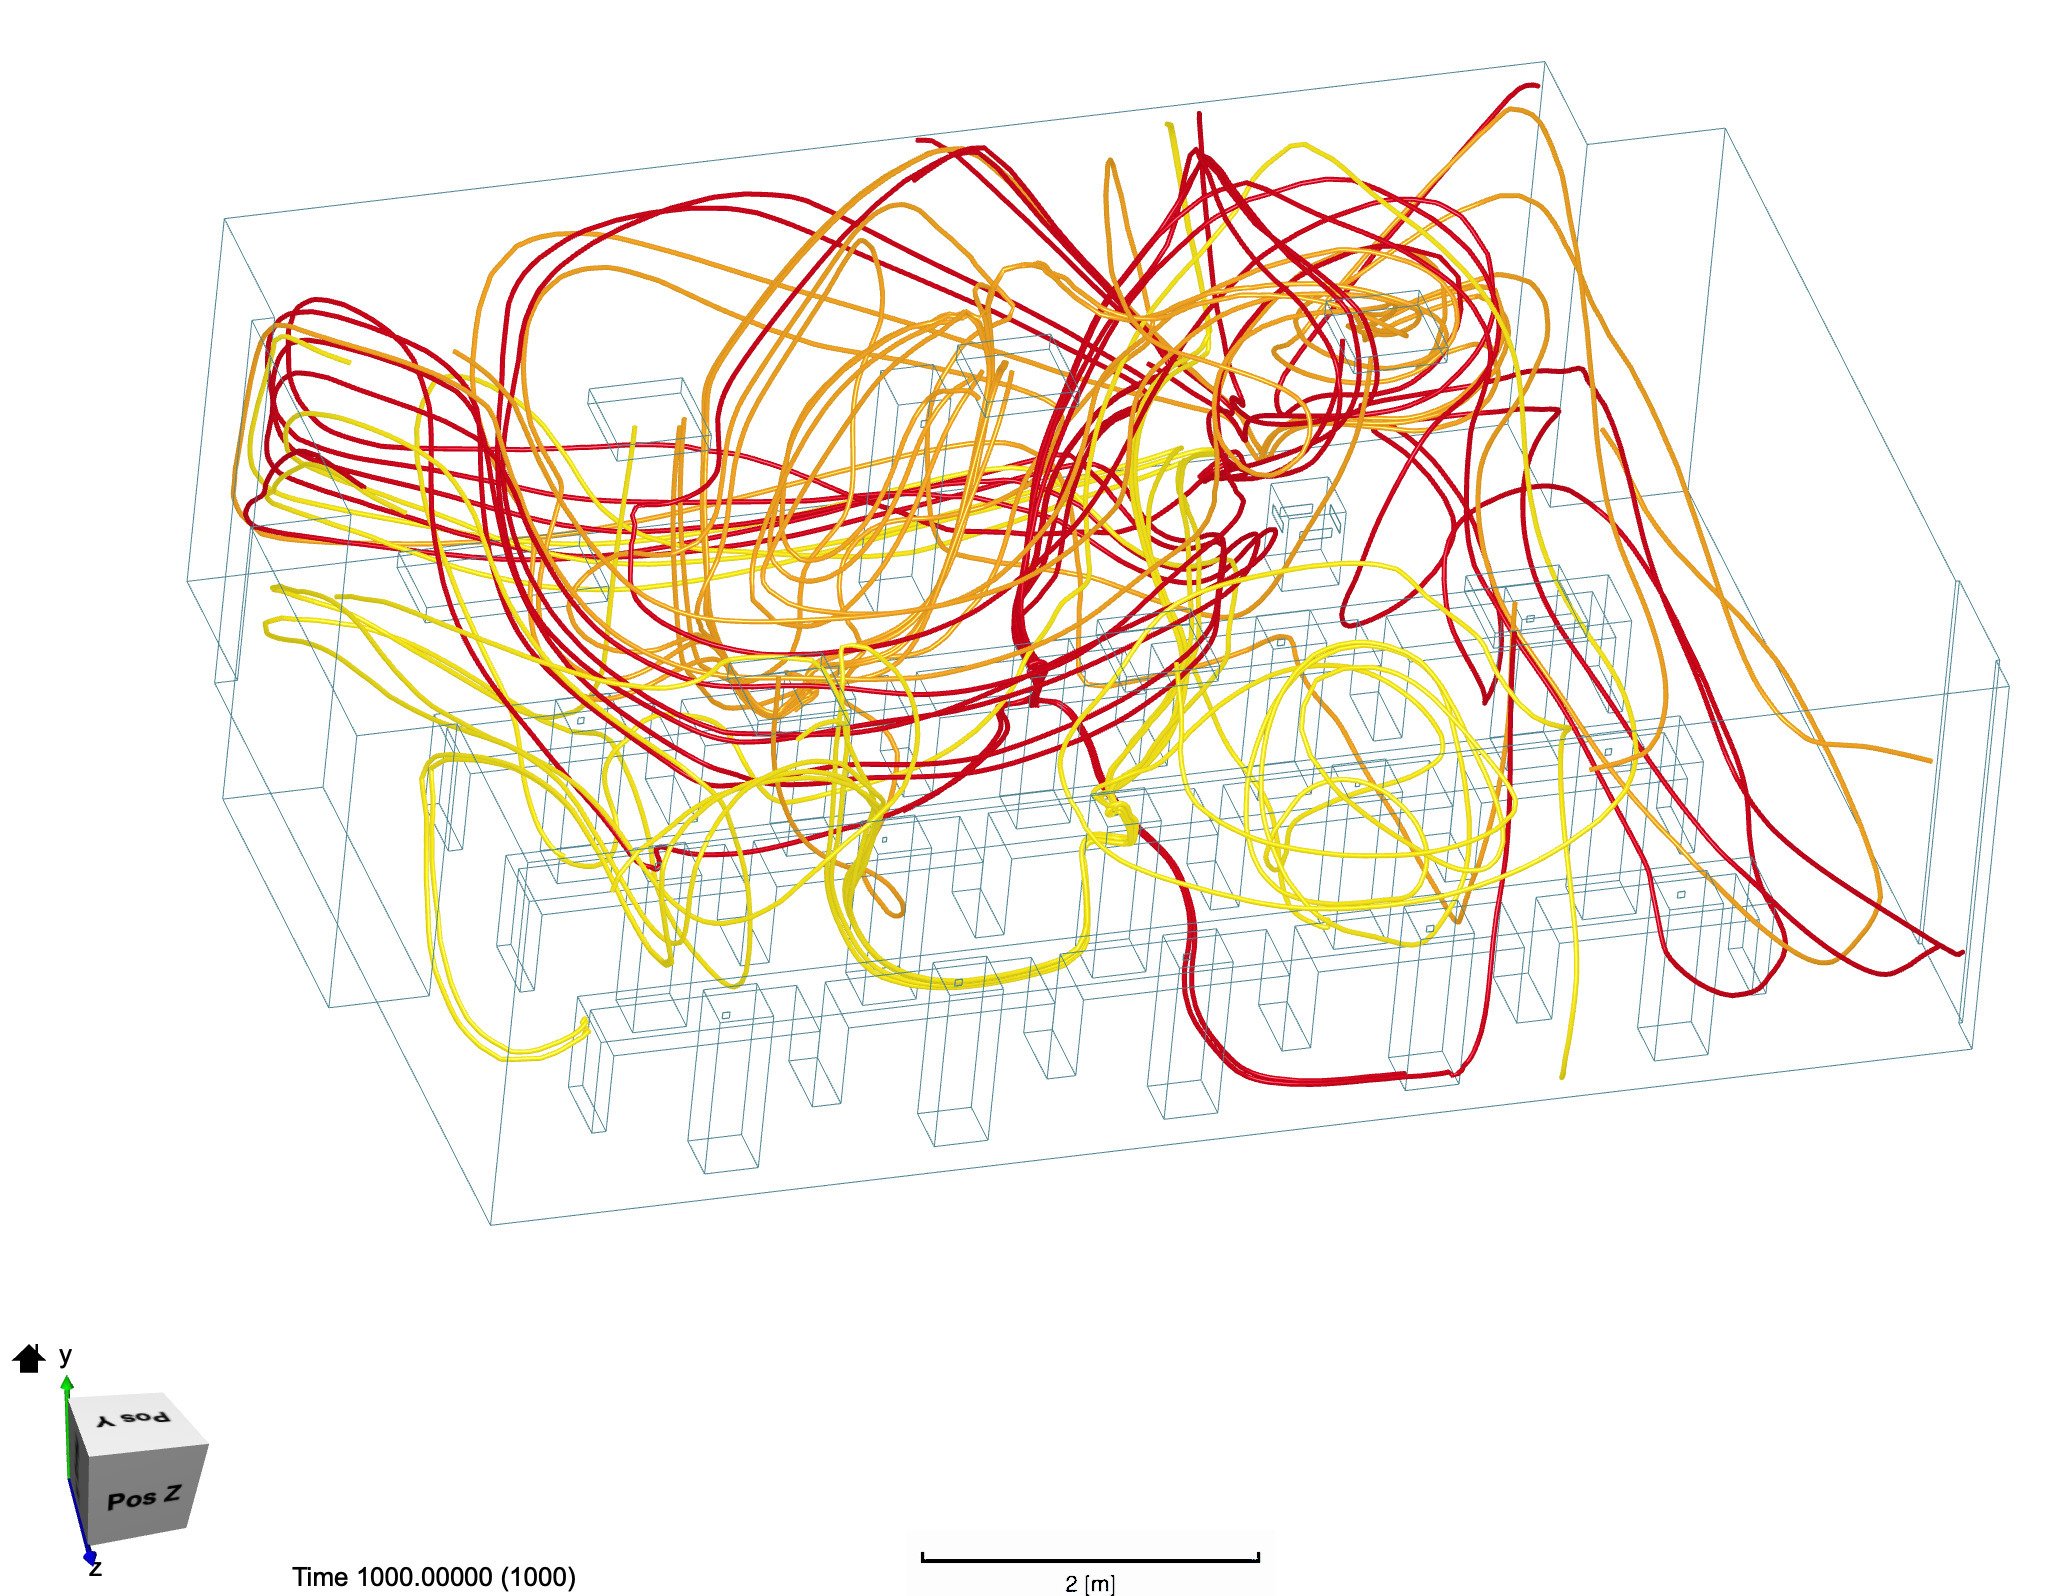
Figure 21. The first of two angles of the same set of particle tracers. Each tracer color represents the exhalation from a different student. Not all students’ exhalation paths are shown. Here, the students’ exhalation follows a similar pattern to the clean air flow originating from the AP. The exhalation cycles back to the AP signifying effective clean air circulation.
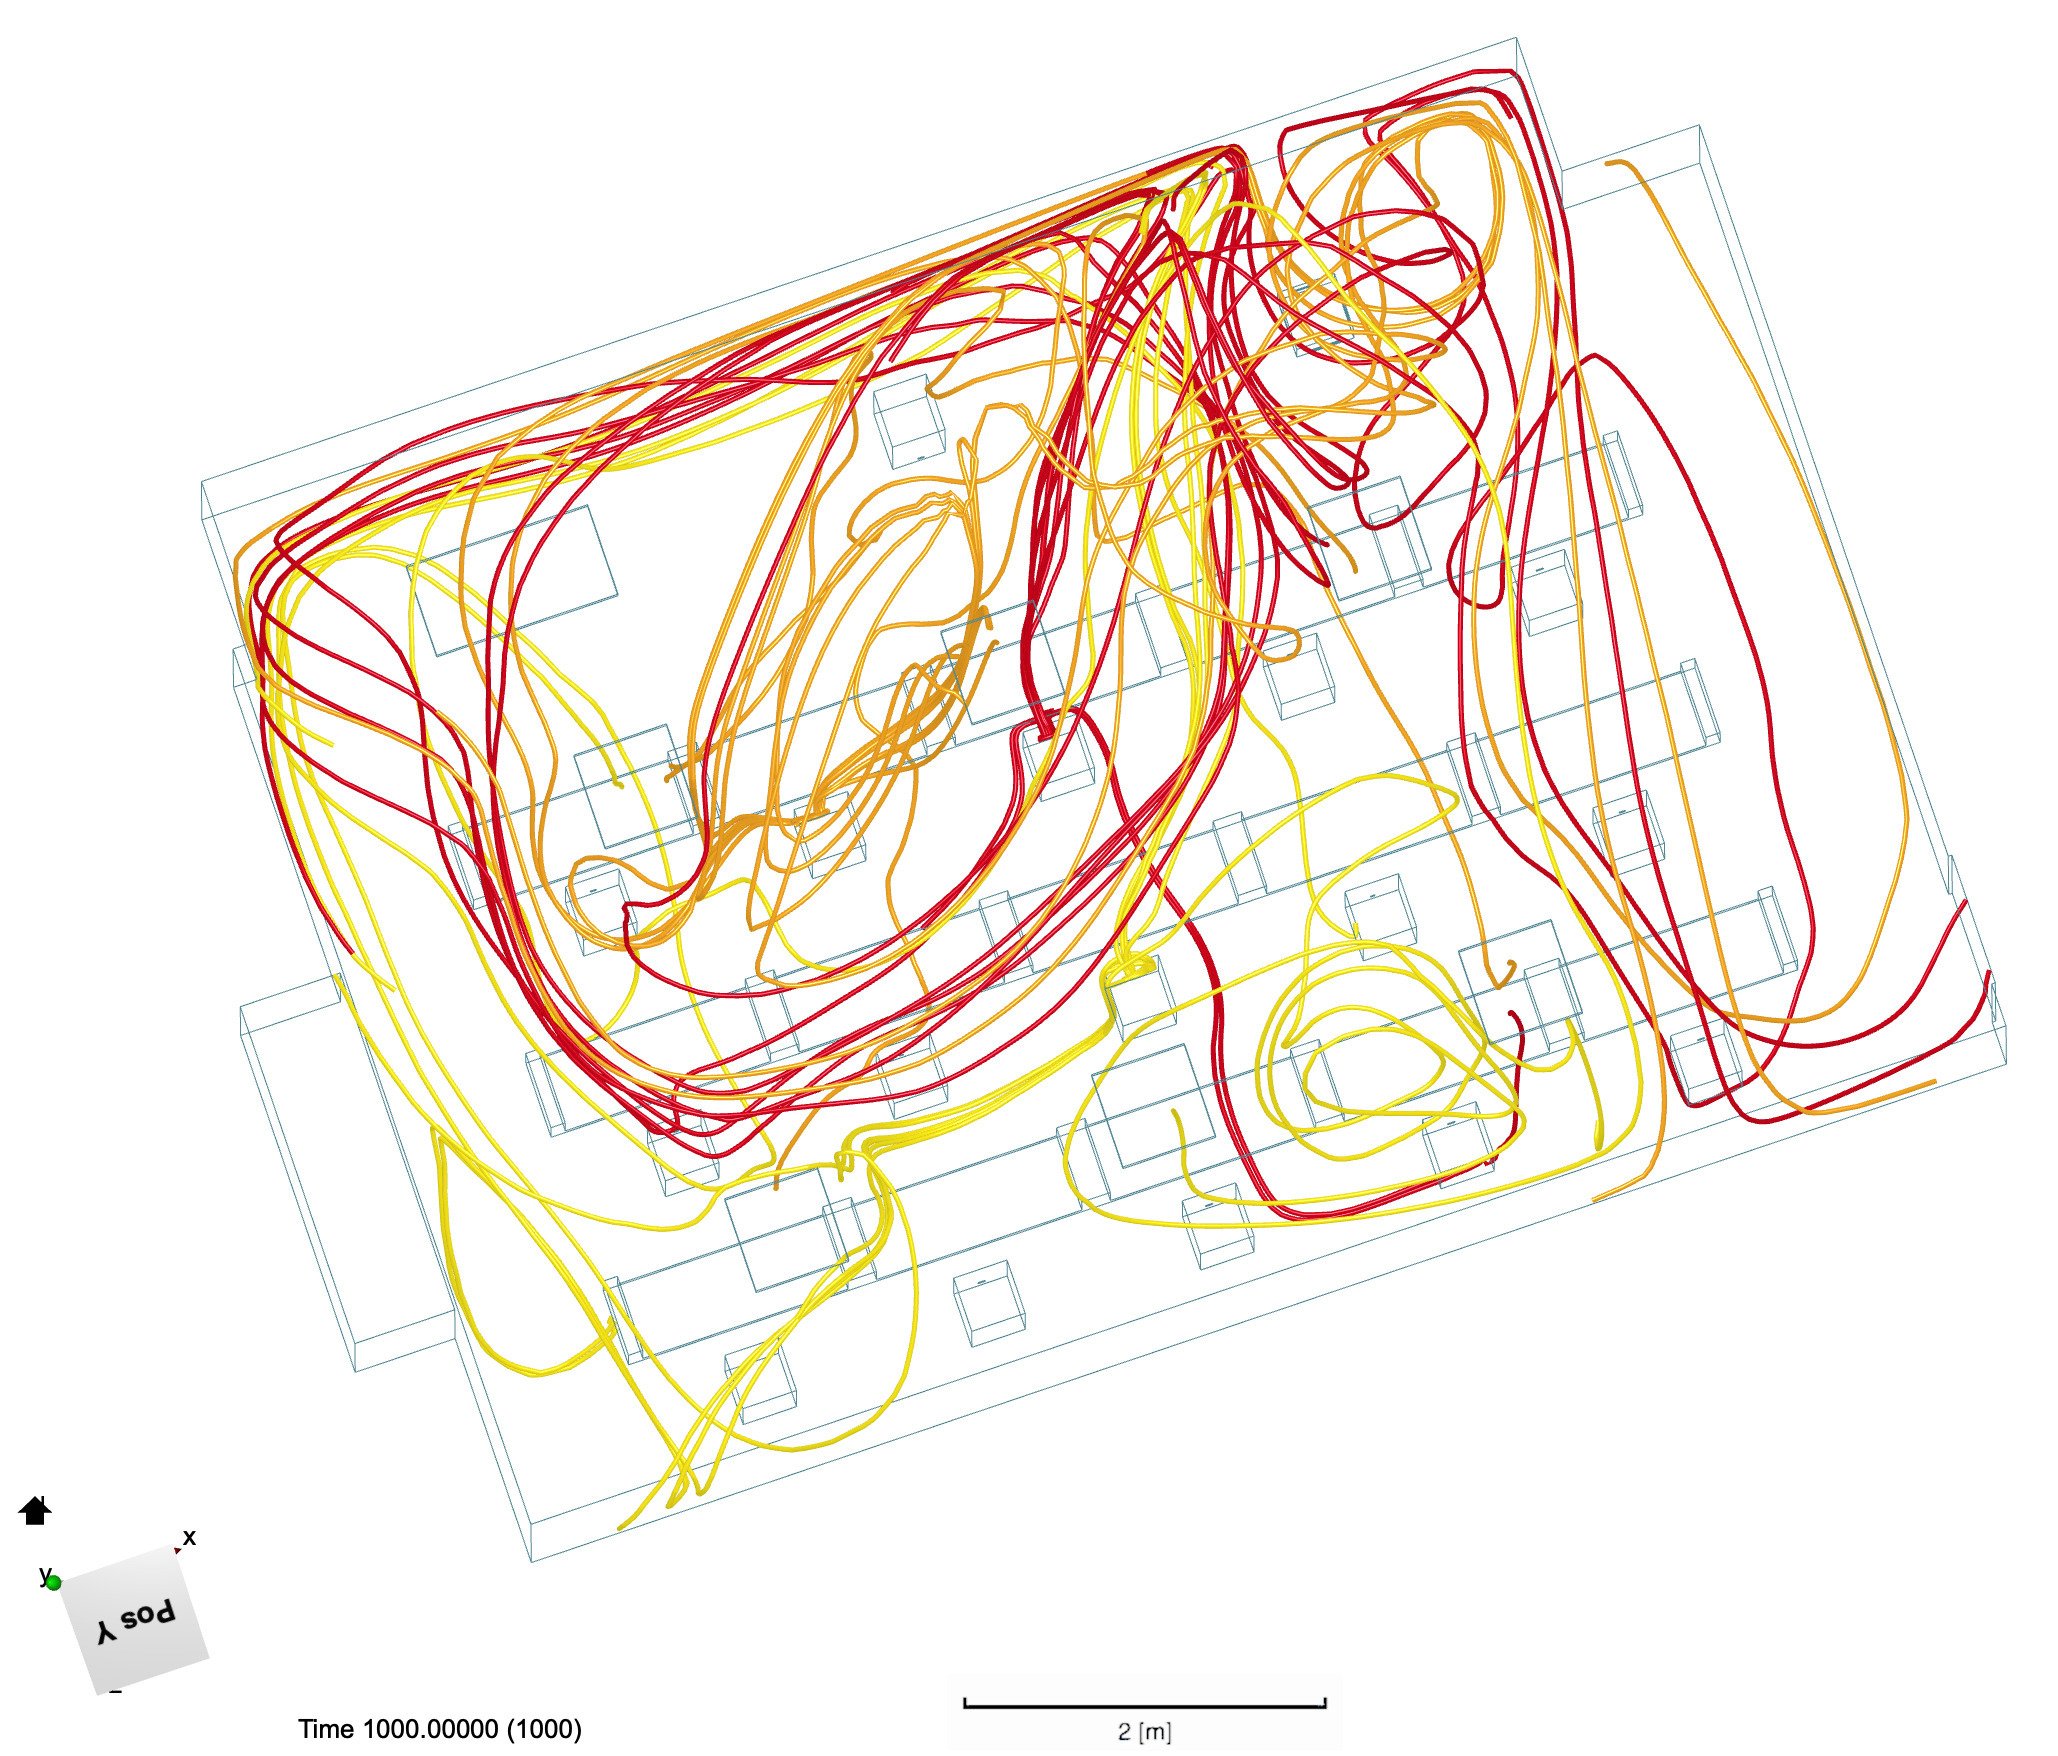
Figure 22. The second of two angles of the same set of particle tracers. See Figure 21 description for additional information.
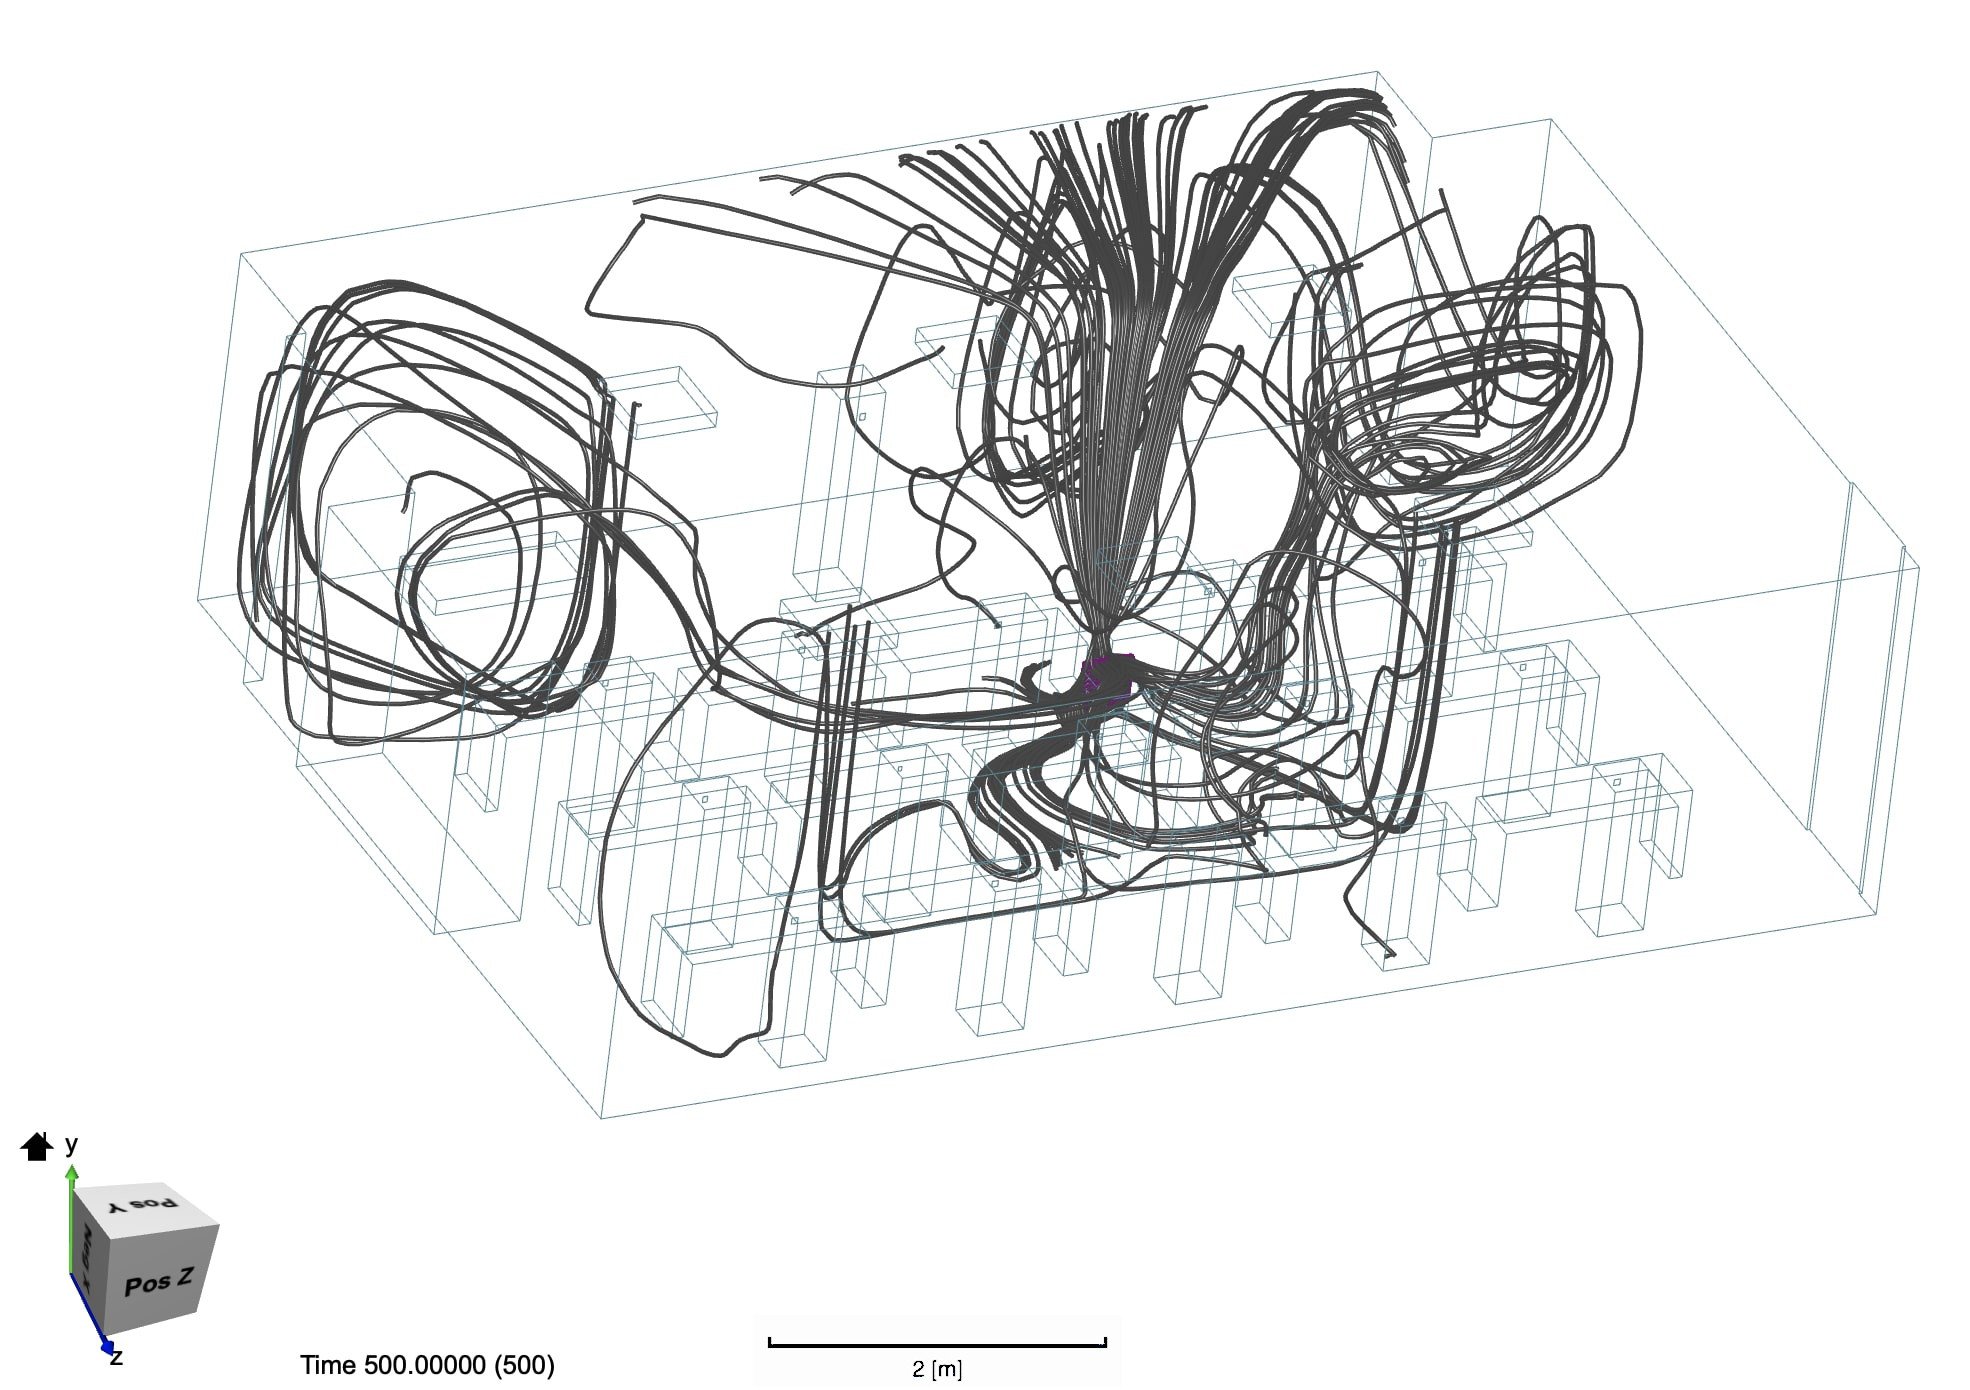
Figure 23. The dark gray particle tracer lines depict the flow pattern of the filtered air after it exits the AP. The exiting air deflects off of the surrounding desks and moves upward into different corners of the room.

Figure 24. The dark gray particle tracer lines depict the flow pattern of the filtered air after it exits the AP. Although flow pattern is different from Figure 23, the students and desks surrounding the AP still serve as obstacles which deflects the flow of air upward towards the roof of the room.
The dark gray particle tracer lines depict the flow pattern of the filtered air after it exits the AP. We see that the clear air moves around the room, covering the edges, and returns back to the AP in a large circular shape.
Scenarios 9, 10, and 11 examined the use of a radial- flow AP in a full classroom. In scenario 9, the AP was placed in the right corner at the front of the room, in the same location as the directed-flow AP in scenario 6 (Figure 4). The resultant clean air flow created a high-density vertical columnof air directly above and adjacent to the AP but decreased the degree to which clean air circulated in the room (Figure 25). The student exhalation patterns revealed a high-density region of air surrounding the professor and minimal diffusion of air throughout the rest of the room based on the placement of the AP (Figures 26, 27). In scenario 10, the AP was placed in the left corner at the front of the room. In scenario 11, the AP was placed in the middle of the room, in a similar location as the directed-flow AP in scenario 7. In neither scenario did the clean air disperse adequately throughout the room (Figures 7, 8). Moreover, in both scenarios, the exhaled air from the students formed vortices that did not disperse effectively throughout the room and instead created pockets of high particle density surrounding the region of the air filter (Figures 28, 29).
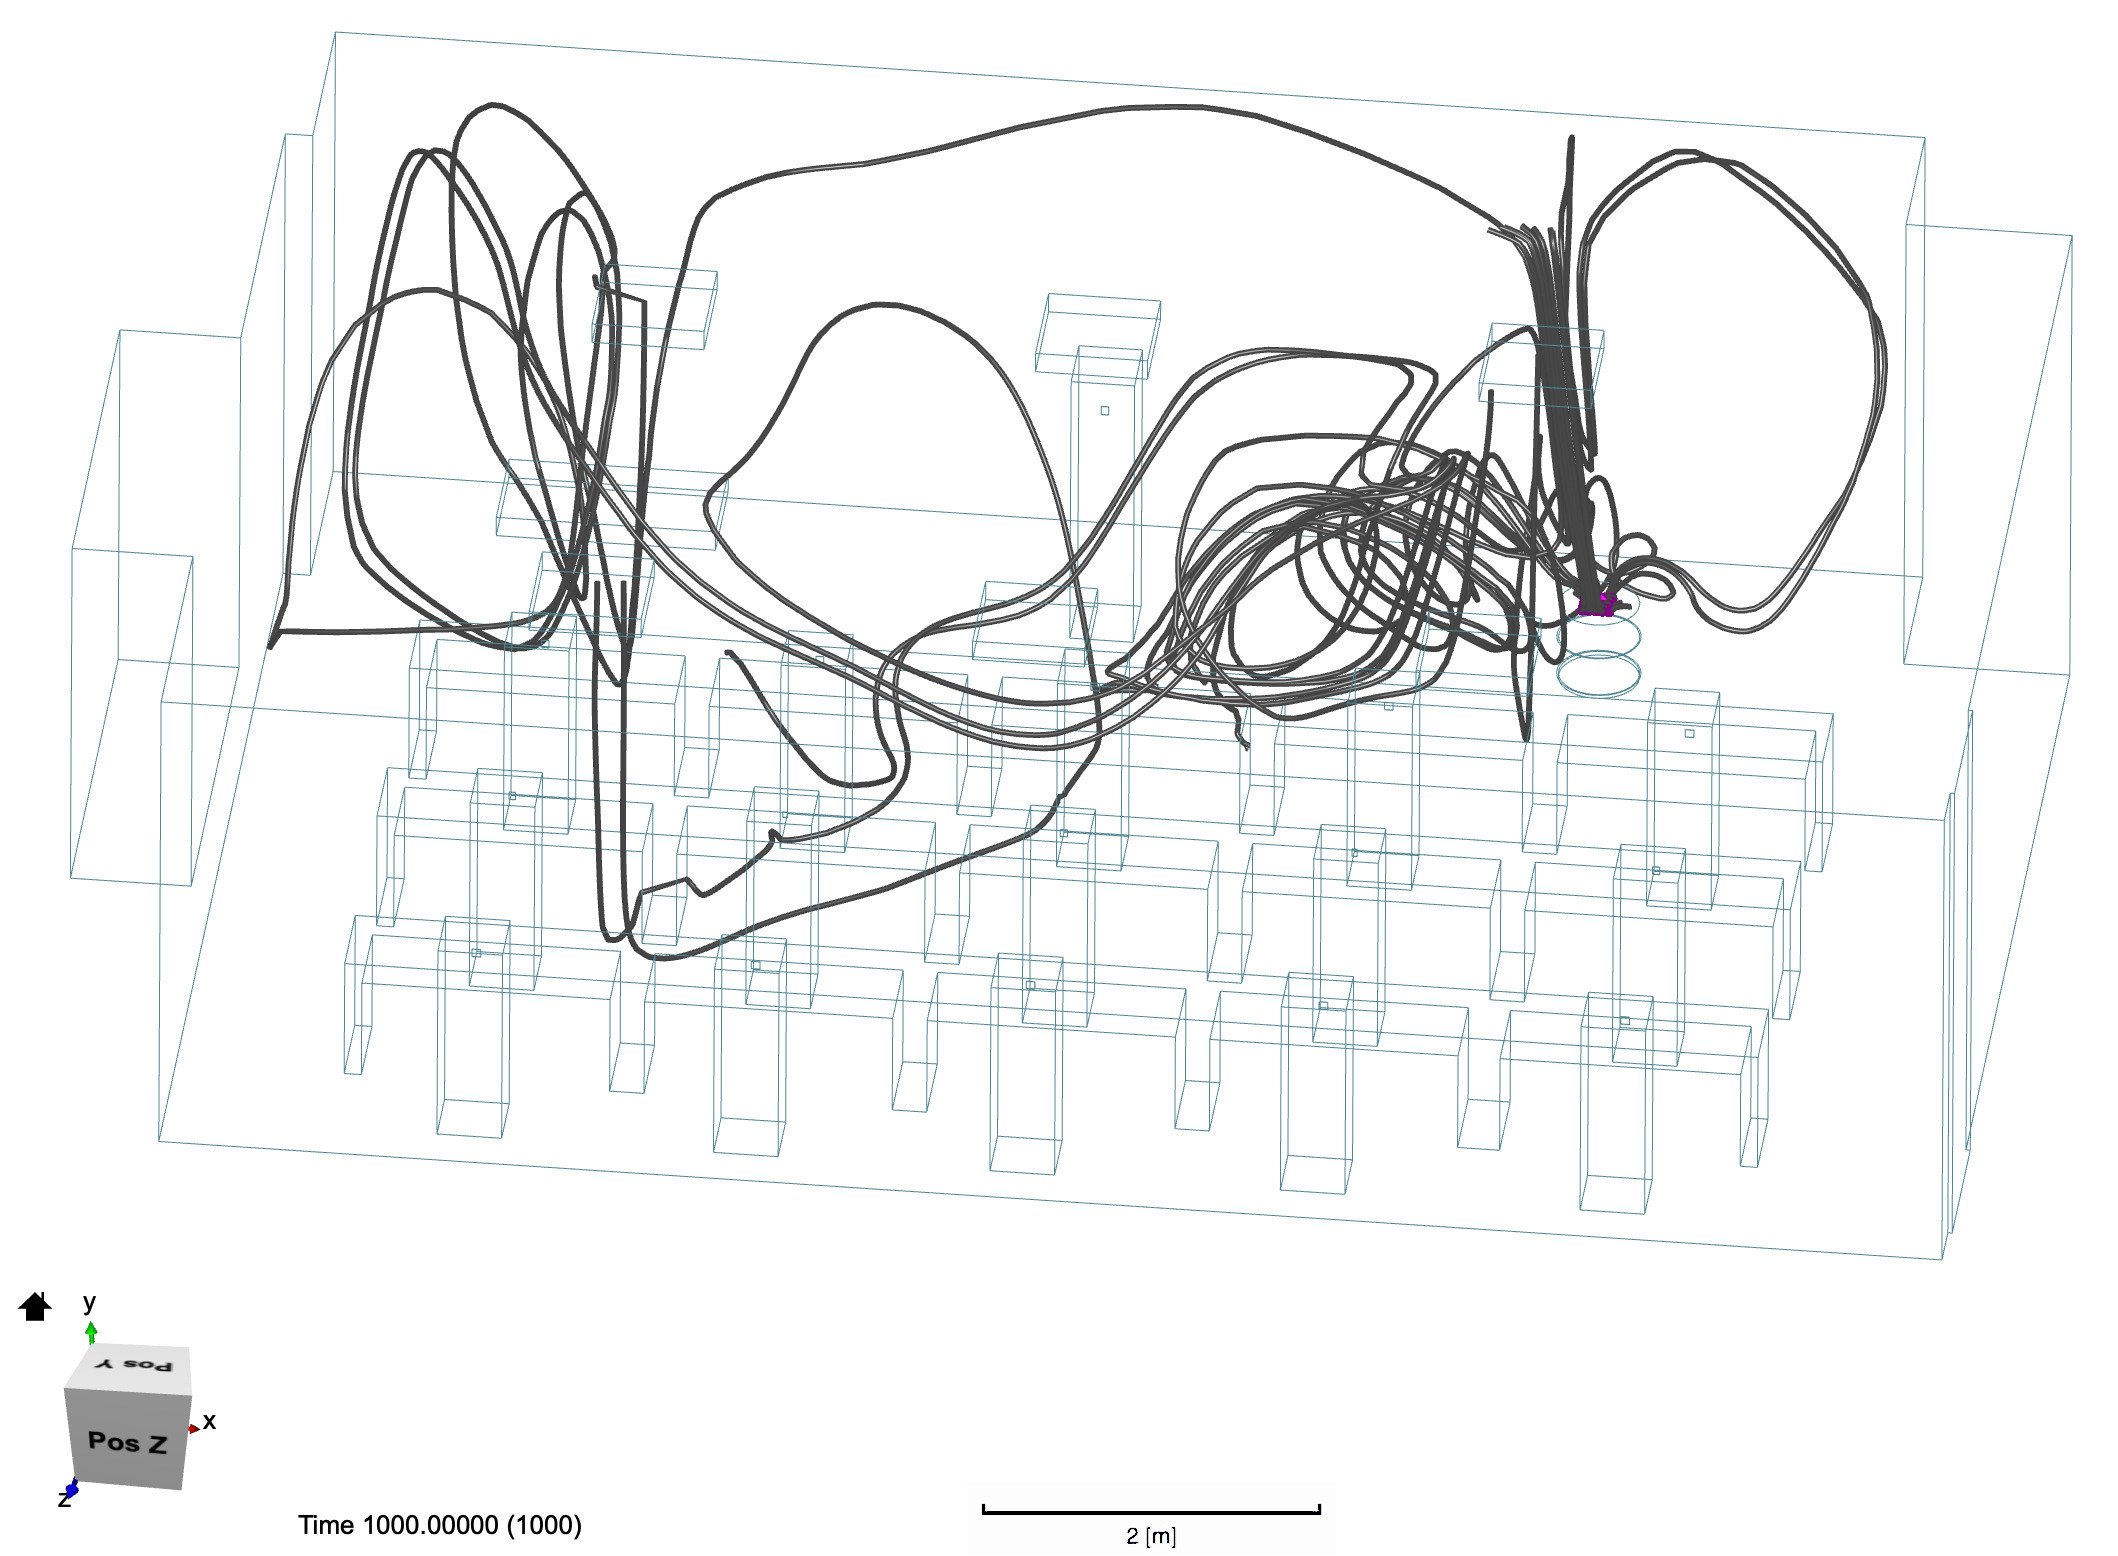
Figure 25. The dark gray particle tracer lines depict the flow pattern of the filtered air after it exits the AP. We see that the clean air ejects from the top of the AP and flows more sporadically throughout the room, concentrating in the region adjacent to the left of the AP. The same AP from Figure 7 is moved to another location. The clean air flow patterns follows that of Figure 7, where clean air concentrates adjacent to the AP and does not circulate throughout the room.
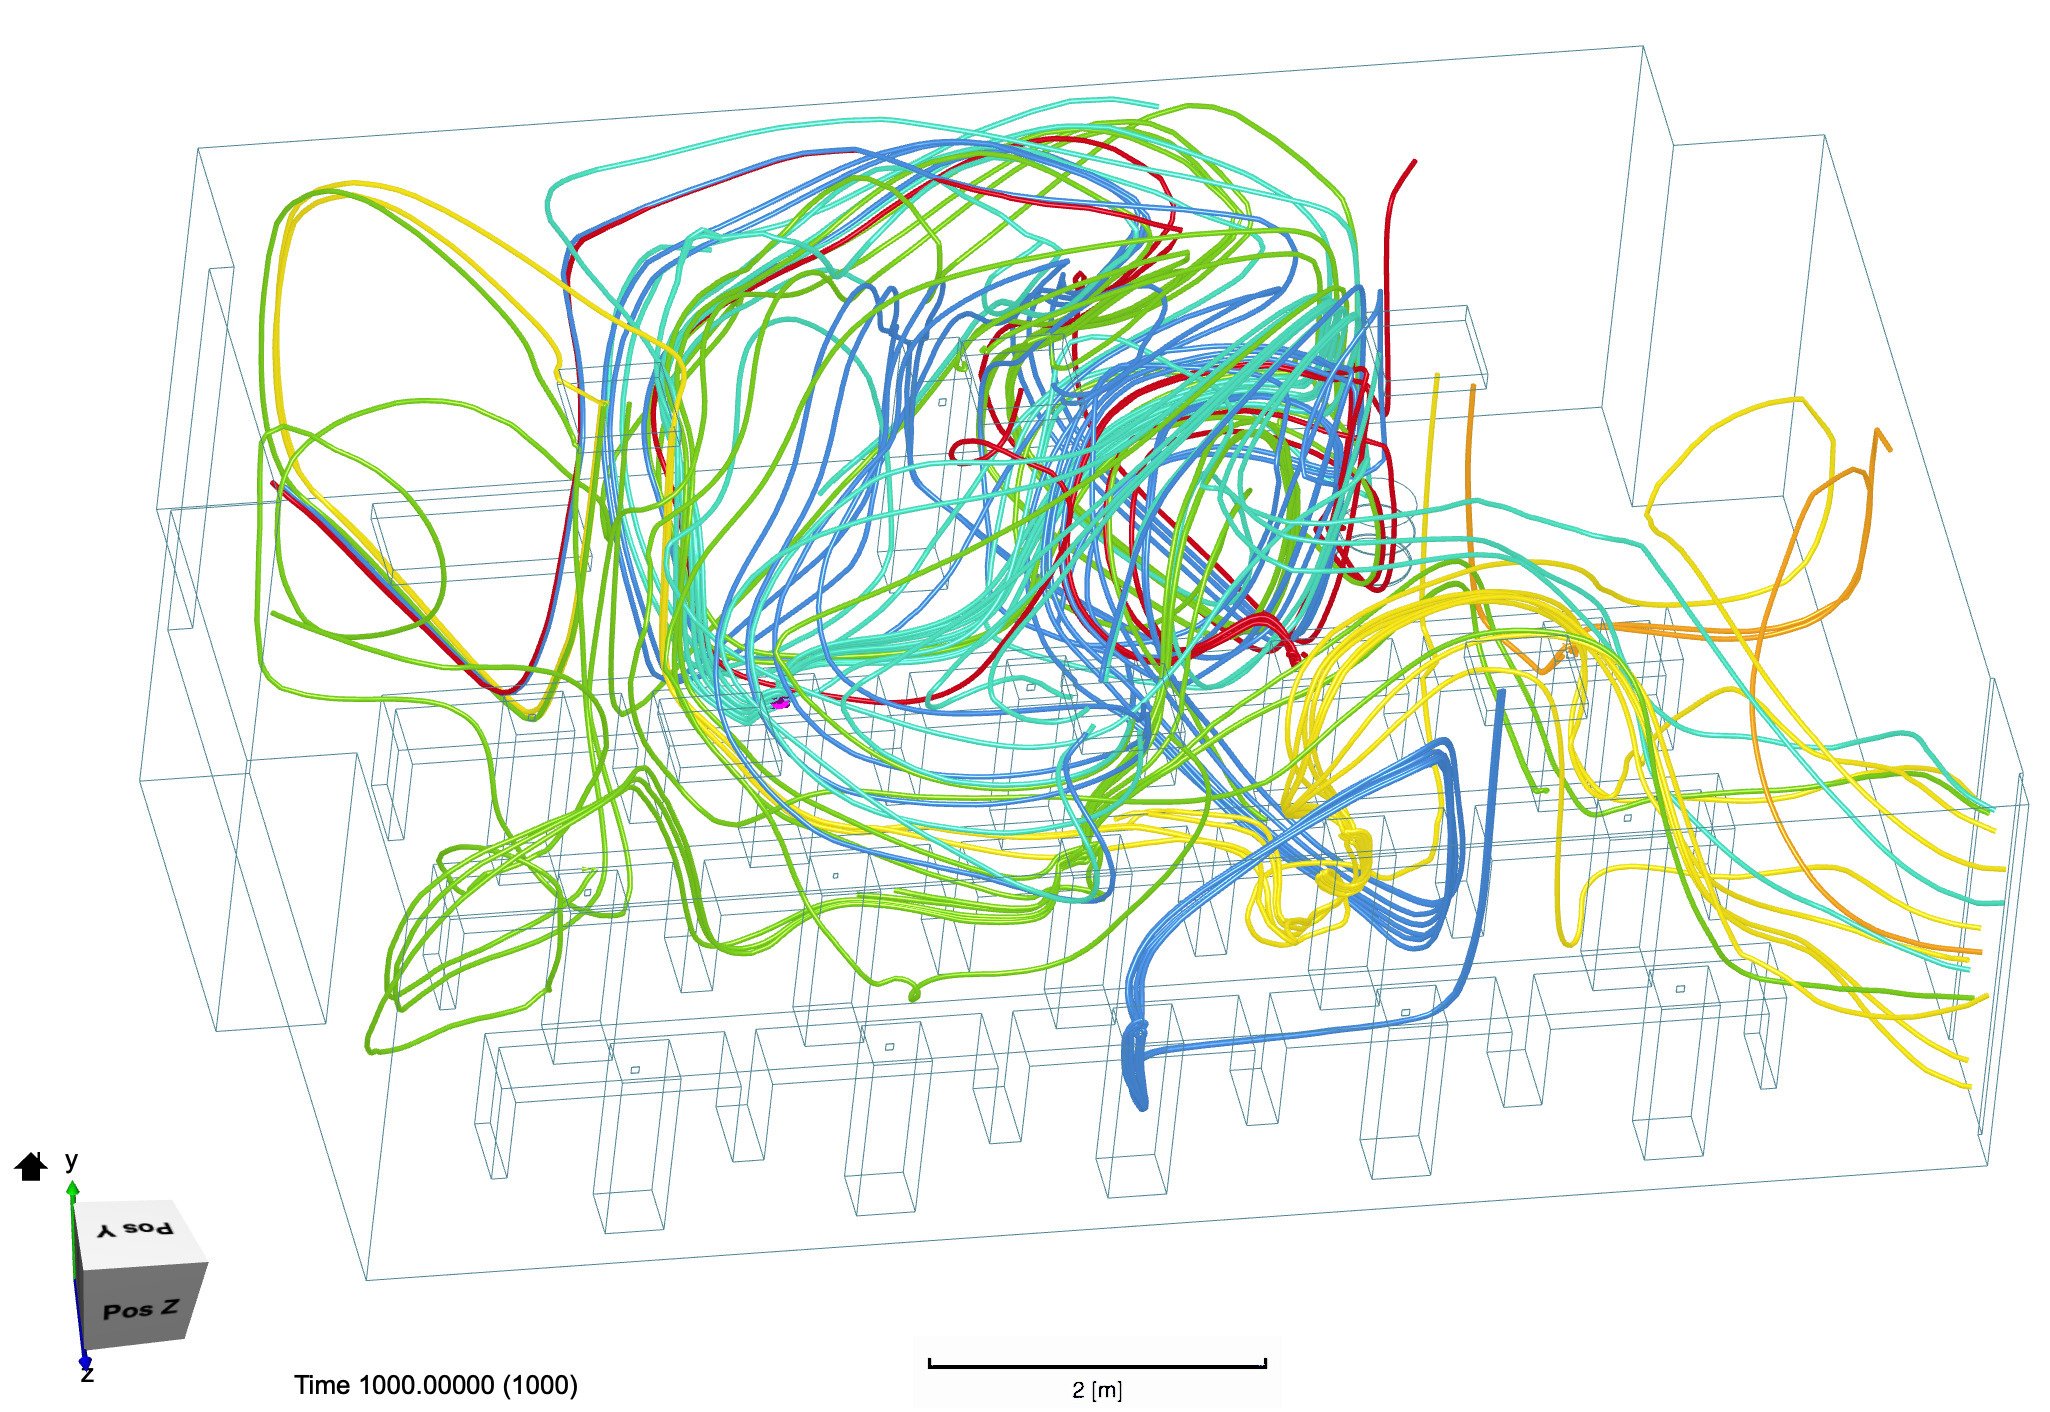
Figure 26. The first of two angles of the same set of particle tracers. Each tracer color represents the exhalation from a different student. Not all students’ exhalation paths are shown. A large vortex forms in the middle of the room with a mix of many different colored tracers. Other regions of the room receive less circulation.
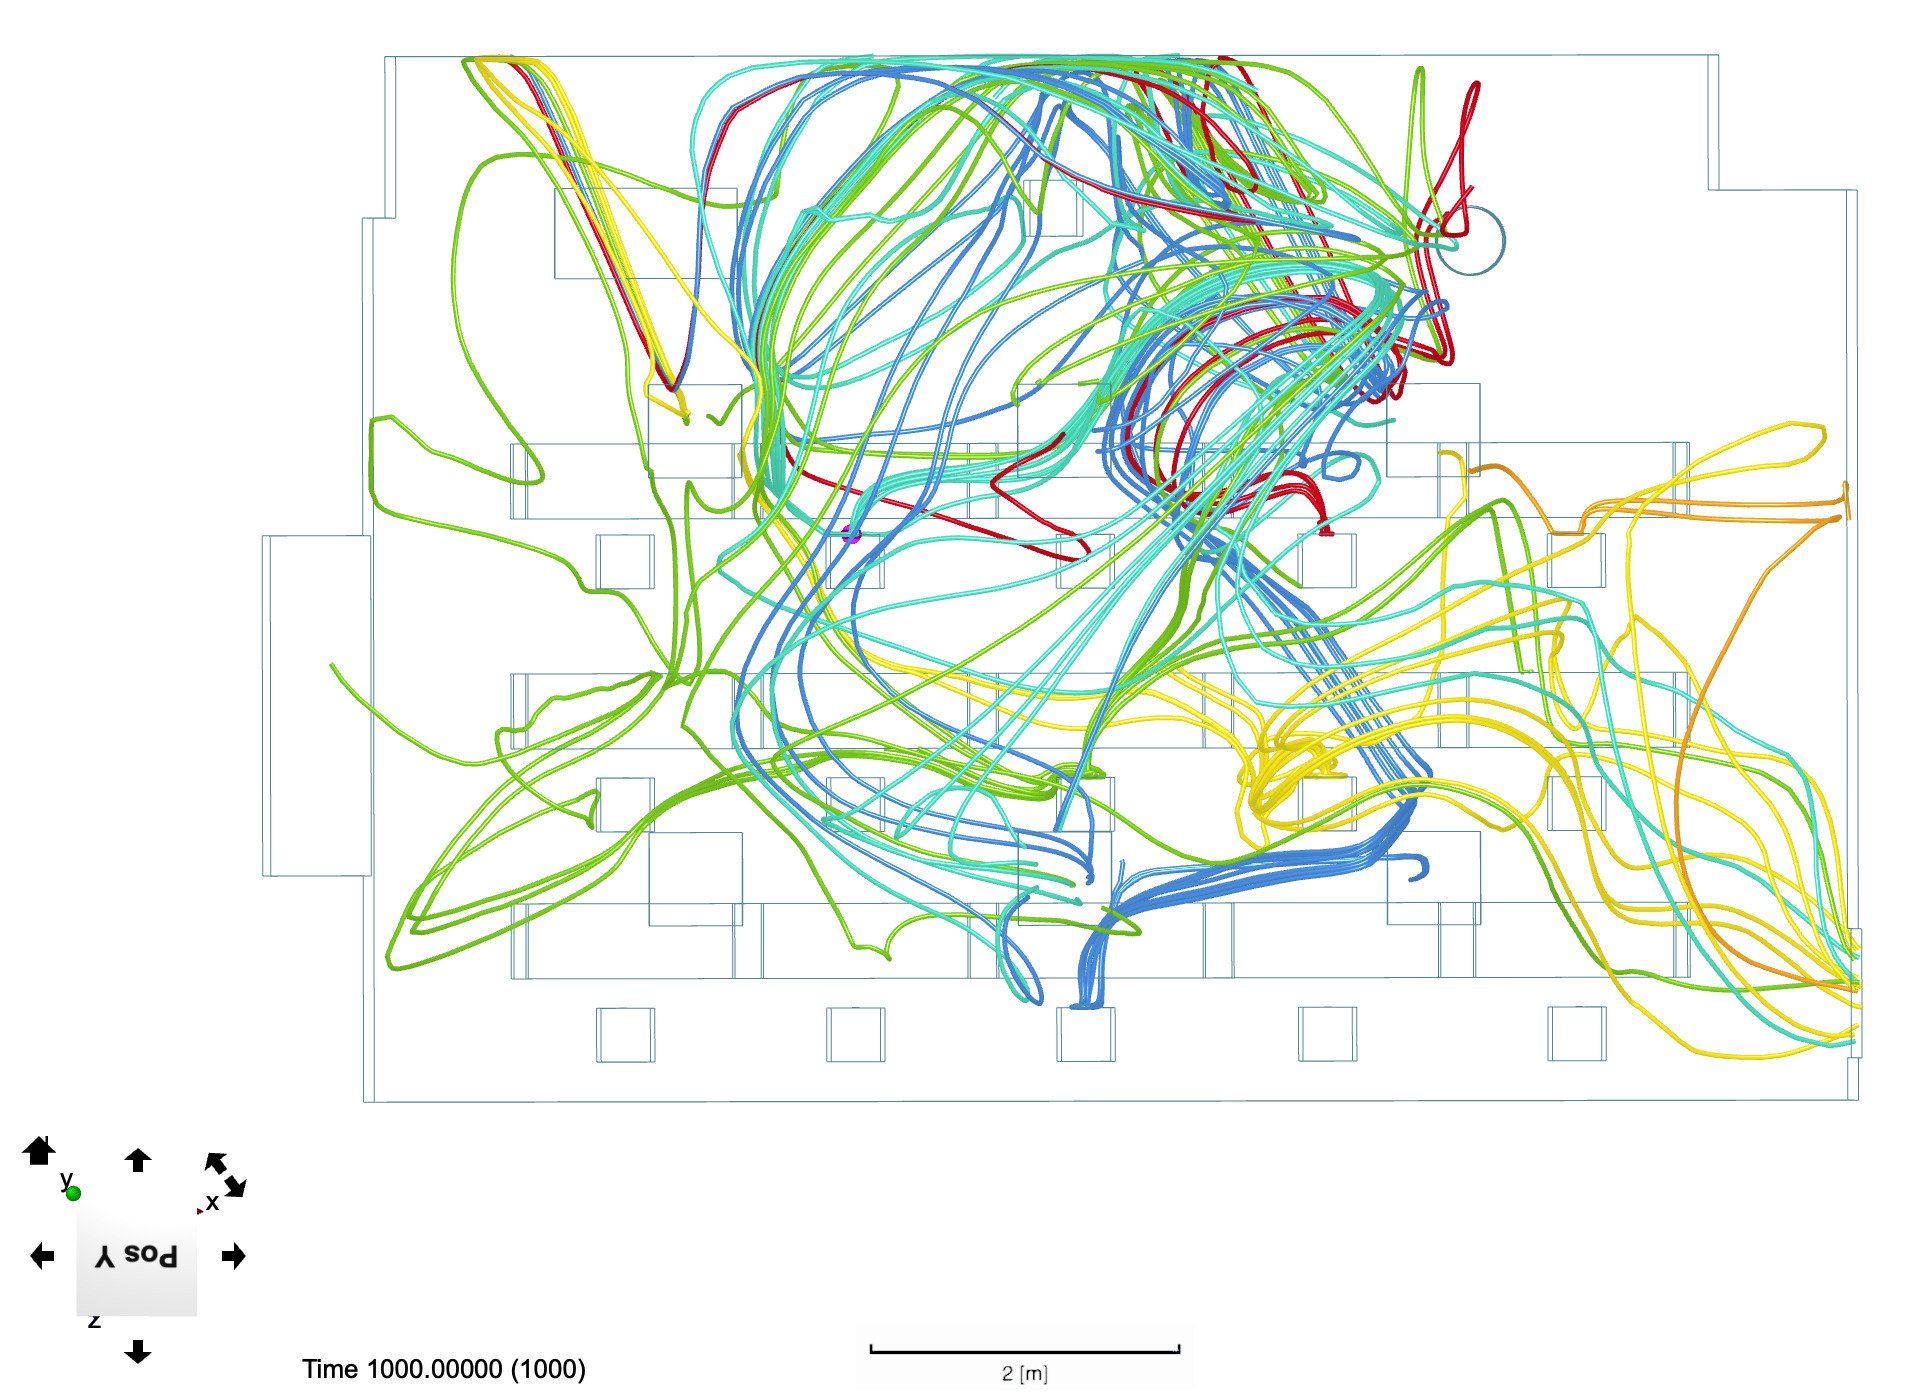
Figure 27. The second of two angles of the same set of particle tracers. See Figure 26 description for additional information.
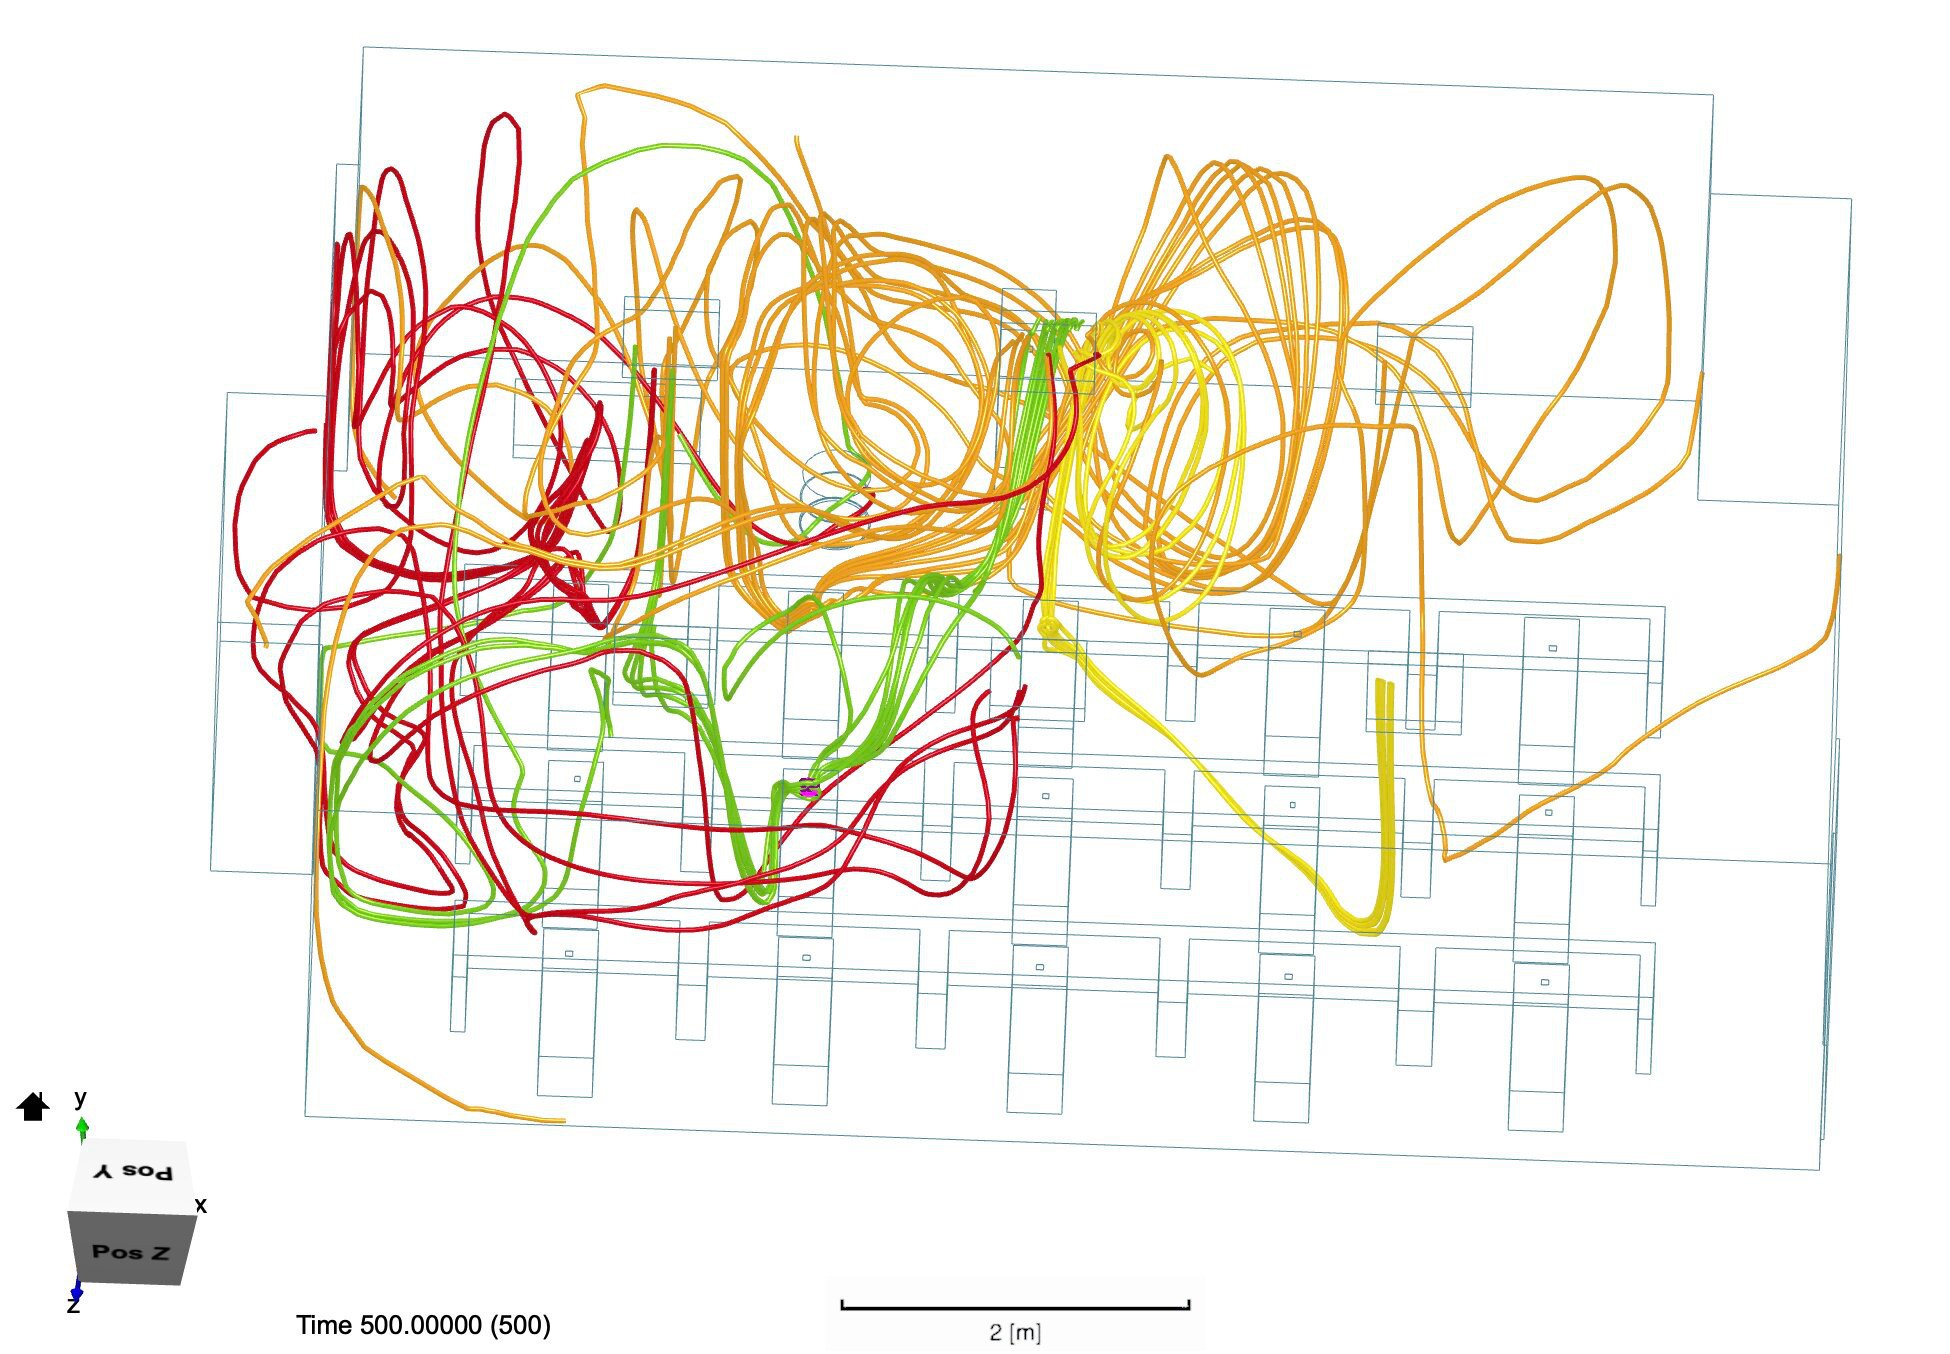
Figure 28. The first of two scenarios where the same circular AP is placed in two different locations. Each tracer color represents the exhalation from a different student. Not all students’ exhalation paths are shown. In both scenarios, the exhalation flow becomes jumbled near the AP and does not cycle throughout the room. In Figure 28, several spirally vortices can be seen in the region adjacent to the AP highlighted by orange and red tracers. In Figure 29, a mix of yellow, green, red, and blue tracers concentrate near the AP.
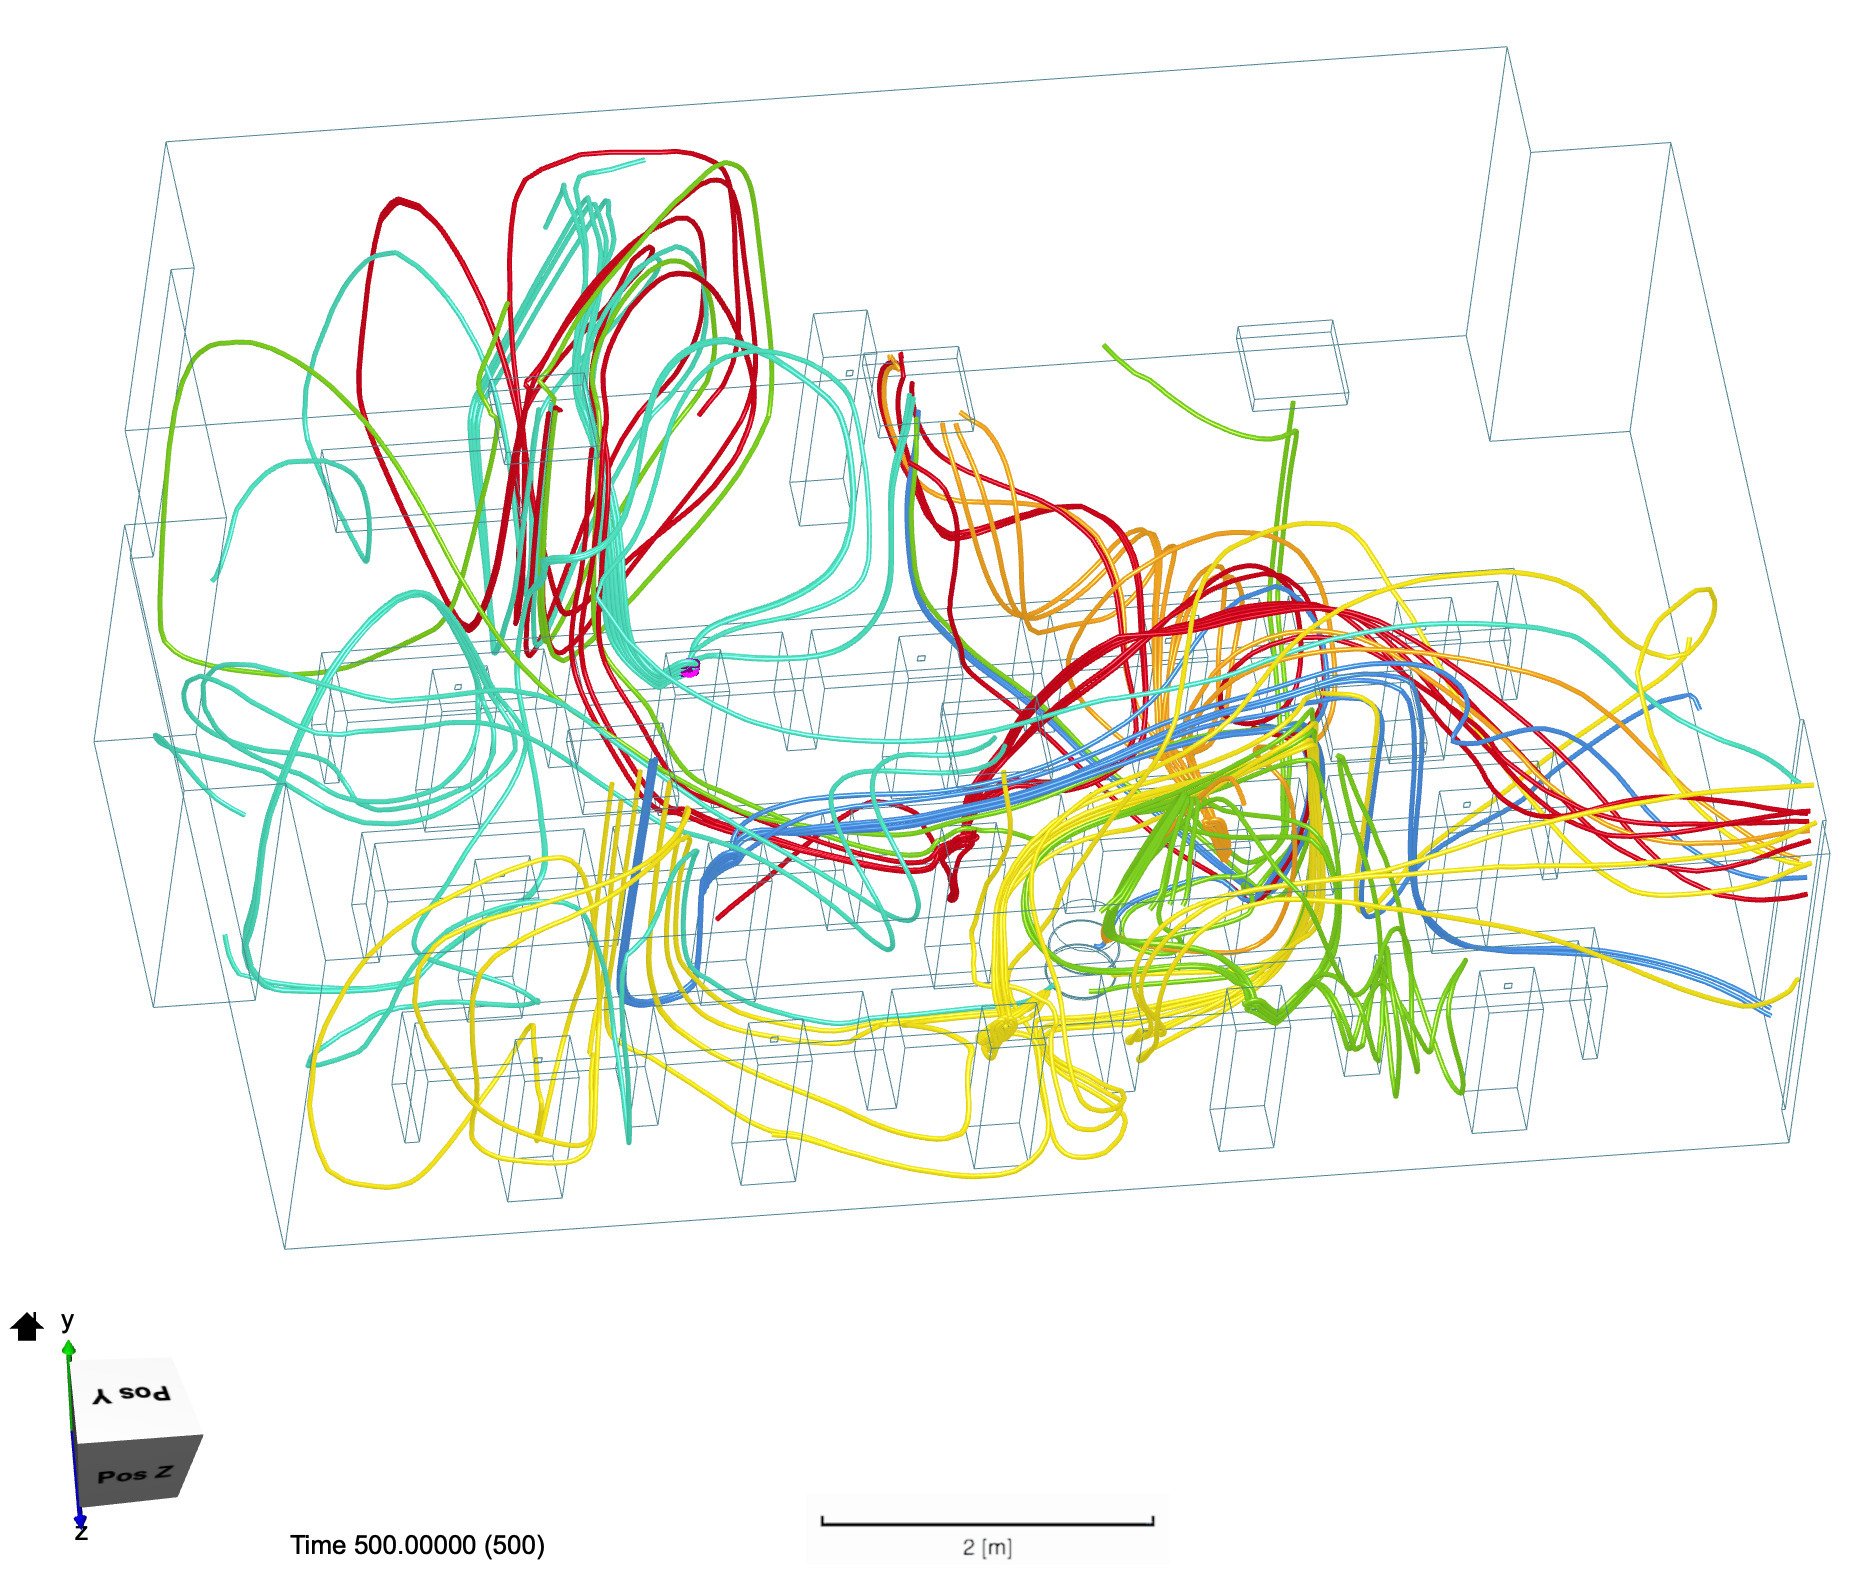
Figure 29. The second of two scenarios where the same circular AP is placed in two different locations. See Figure 28 description for additional information.
Lecture Hall
Scenario 12 examined a half-occupied lecture hall with students spaced evenly between each other (Figure 9). The current emerging from the inflow vents was analyzed, which revealed airflow streams that created two vortices wrapping around the walls of the auditorium and through the center of the room, eventually converging at the front of the room where the outflow vents are located (Figure 30). The resultant patterns of student-exhaled particles showed that air is trapped in two zones. These zones featured high particle density relative to other regions of the auditorium (Figure 31).

Figure 30. The airflow in the lecture hall based on ventilation with inlets at the top back of the classroom and outlets in the top front is represented by the blue lines. As shown, they form two symmetrical circular patterns moving along the walls.

Figure 31. Particle flow through the room assuming each individual is exhaling. We see that the exhalation patterns largely follow the ventilation in the room as depicted in Figure 30. Students at the center of both halves of the lecture hall reside in the areas of the room with the most concentrated cross contamination of exhalation.
Given the pattern of the airflow examined in scenario 12, a new layout was analyzed in scenario 13 where individuals were seated in a ring formation at decreased capacity, avoiding the areas with significant air cross contamination along the walls and in the middle of the auditorium. The results of this analysis revealed significantly reduced exhalation density in the previously high-density areas of the room, with exhaled particles flowing from the students to the outflow vents with less turbulence (Figures 10, 32).

Figure 32. Two angles of the airflow of the students’ exhalation after they are arranged in a concentric ring formation as depicted in Figure 33. We see that the previous vortices shown in Figure 31 and now resolved and air instead gathers more so at the front of the room where the outlets are located.
Literature Review: Filters and Ventilation
HVAC Filters
Air recirculation, especially with improper filtration, through building HVAC systems can enable SARS-CoV-2 aerosol transmission (Morawska et al., 2020). The Minimum Efficiency Reporting Value (MERV) of a filter is the standard measurement used by the American Society of Heating, Refrigerating, and Air-Conditioning Engineers (ASHRAE) to quantify a filter’s efficiency (ASHRAE, 2013). In general, a higher MERV rating corresponds to an increased particle- removing efficiency (Azimi et al., 2014). In fact, ASHRAE’s guidelines outline that MERV9-MERV12 filters should be used to target particles of 1.0-3.0 µm, while MERV13- MERV16 filters are efficient at filtering particles 0.3-1.0 µm. Congruent with ASHRAE’s guidelines, Azimi et al.’s testing (2014) of different MERV filters demonstrated that the lowest efficiency reached by MERV14 filtered about 60% of particles approximately 0.3 µm in size, with lower ratings (MERV5 to MERV10) demonstrating a 0 to 30% efficiency at removing particles in this range.
The SARS-CoV-2 virus particle has been measured to be 0.125 µm in diameter. However, SARS-CoV-2 particles are typically attached to carrier molecules such as water that bulk up the size of an aerosol. Thus, SARS-CoV-2 aerosols can range from 0.1 to 5.0 µm in size (Wang and Du, 2020). An analysis of air samples collected in a Wuhan hospital during the peak of the COVID-19 outbreak in China revealed that SARS-CoV-2 aerosols were found in two size ranges: a submicrometer (0.25-1 µm) and a supermicrometer (>2.5 µm) range (Liu et al., 2020). As it is very possible that infectious aerosols fall in the 0.3 µm range, increasing a filter’s MERV value in buildings where air is recirculated will significantly help to remove SARS-CoV-2 aerosols from air systems, thus decreasing the risk of aerosol spread.
The High Efficiency Particulate Air (HEPA) filter, a commonly used and extremely efficient HVAC filter, filters out a minimum of 99.97% of particles 0.3 µm in size. Any airborne particles larger than 0.3 µm have a nearly 100% rate of capture (Perry et al., 2016). Due to its high efficiency, the HEPA filter has been mandated for many healthcare spaces for airborne microorganism removal, including SARS-CoV-2 (ASHRAE, 2013). However, HEPA filters may not be compatible with classroom HVAC systems, as they require a higher throughput of air to maintain constant airflow due to the small filter pores. HVAC systems in medical settings are specially designed to be able to push air through HEPA filters, while typical HVAC systems often do not have that power. The effect of filtration efficiency given the variations in ventilation system designs is subject to further study. In systems where upgrading to a higher MERV filter or installing a HEPA filter is not possible, portable APs equipped with HEPA filters can be used to improve the cleanliness of the air.
Portable Filters
Portable APs, which are able to capture and remove airborne particles and pollutants, can potentially increase air exchange rates and remove SARS-CoV-2 aerosols from enclosed spaces (Zhao et al., 2020). While their filtration efficiency with respect to SARS-CoV-2 has yet to be experimentally proven, the ability of portable APs to remove toxins and infectious particles and increase the number of air exchanges in a room infer potential efficacy at minimizing SARS-CoV-2 aerosol transmission (Association, 2020).
Several factors contribute to a portable AP’s efficacy, including the Clear Air Delivery Rate (CADR) rating, the size of the room, the type of filter installed, and the maintenance of the filter (Association, 2020). CADR is given in cubic feet per minute and describes the volume of clean air the purifier injects into a space per minute. The U.S. Environmental Protection Agency’s Guide to Air Cleaners outlines that portable APs should provide at least five full room air exchanges per minute (Agency, 2018a). These guidelines can be generalized with Equation 2:

In this manner, a properly scaled AP can reduce the risk of aerosol transmission. AP maintenance requires routine filter replacement, which should be executed with caution and proper PPE to prevent breathing in pathogens on the filters (Agency, 2018b; Zhao et al., 2020).
Literature Review: Temperature and Humidity
Viruses typically demonstrate higher inactivation rates at higher temperatures, and various studies have confirmed this result for different coronaviruses (Casanova et al., 2010). However, the effect of humidity on coronaviruses, especially aerosolized coronaviruses, is still debated. In 2010, Casanova et al. found mid-range RH values (~50%) to optimize surrogate coronaviruses transmissible gastroenteritis virus (TGEV) and mouse hepatitis virus deactivation at ambient/room air temperatures on steel surfaces. Contrarily, Ijaz et al. found mid-range RH values (~50%) to optimize aerosolized coronavirus (coronavirus HVC/229E) survival at 20◦C (Ijaz et al., 1985). Contradictory to both these studies, Kim et al found that aerosolized TGEV viability decreased continuously with increased RH values at 23◦C (Kim et al., 2007). Thus, there does not seem to be a scientific precedent regarding the optimal humidity level for minimizing SARS-CoV-2 viability in aerosols at room temperature, and the effects on viability may be strain and environment specific.
Literature Review: Disinfection/Sanitation
While virus-laden aerosol removal can occur through diffusion and ventilation solutions, several steps can be taken to deactivate the airborne virus directly. These solutions include using ultraviolet germicidal irradiation (UVGI) sanitization, taking advantage of natural light sources, and considering fogging machines.
UVGI Usage
UV light, especially in the range of UV-C (200-280 nm), has been documented to be effective at inactivating many viruses through high energy waves that damage protein and nucleotide structures and inhibit viral reproduction (Lytle and Sagripanti, 2005; Mcdevitt et al., 2012). The use of UV- C light to deactivate germs is usually referred to as UVGI or germicidal ultraviolet (GUV) (ASHRAE, 2013). UVGI is particularly effective at deactivating single-stranded RNA (ss- RNA) viruses like the SARS-CoV-2 virus (Memarzadeh et al., 2010). While the effects of UV-C on SARS-CoV-2 have not been extensively tested, the virus’s susceptibility to UV-C can be theoretically deduced from UV-C’s deactivating effect on other ss-RNA and coronaviruses.
Upper-room GUV is a technique that utilizes UV light disinfection properties to deactivate viruses in the upper regions of a room. In upper-room UVGI, UV-C light is shone in the region of the room above human height, thereby slowly irradiating bioaerosols that enter the upper-room. As the UV-C rays are designed to avoid room occupants, the technique is not harmful to humans. This technique has demonstrated some efficacy at deactivating bioaerosols and is most commonly used to reduce tuberculosis (TB) transmission. When upper-room GUV was introduced in a TB-isolation ward, secondary infections decreased from 35% to 9.5% (Escombe et al., 2009). When implemented in crowded elementary school classrooms, results from real-time bioaerosol monitors showed that implementation of upper-room UVGI significantly decreased bioaerosol concentration on 13 out of 20 of the days tested (Su et al., 2017). While the technique has not been tested with the SARS-CoV-2 virus, it can be reasonably assumed that since UVGI has demonstrated efficacy in killing other ss-RNA viruses and coronaviruses, UVGI irradiation will likely be efficient at deactivating a significant amount of SARS- CoV-2 virus particles (Memarzadeh et al., 2010). However, in order to completely deactivate the virus, a sufficient dose of UV light needs to be absorbed, which is hard to attain with constantly moving air. Thus, while upper-room UVGI can decrease the concentration of bioaerosols in a space, upper-room UVGI should only be considered as a supplementary and not a standalone technology (Agency, 2018b; Memarzadeh et al., 2010; Zhao et al., 2020). Further testing of upper-room GUV’s effects on reducing bioaerosol levels in classrooms would clarify the technology’s efficacy.
Installing an overhead or standing UVGI light takes advantage of the germicidal properties of UV-C light in a similar manner to upper-room UVGI. However, instead of irradiating a specific portion of the room, an overhead or standing UVGI light irradiates the entire room (or specifically wherever the light rays will reach), and thus should only be used when the room is unoccupied. An overhead or standing UVGI light can serve to clean the air in a time frame when students are moving between classrooms to prevent build-up of aerosolized virus particles. To summarize, while upper-room UVGI serves to clean the air while people are in the room, overhead/standing UVGI serves to clean the air between periods of occupancy.
Exposure to Visible Light
Exposure to natural light has been associated with pathogenic inactivation. Specifically, blue light has demonstrated efficacy in partially deactivating a host of bacterias and viruses, including non-SARS-CoV-2 coronaviruses (Dai et al., 2012; Enwemeka et al., 2020). Thus, room expo- sure to blue light (present in natural light) is a simple way to reduce the risk of COVID-19 infections and bacterial or viral secondary infections to COVID-19. Future research should delve deeper into the use of blue light as a disinfecting medium similar to the use of UV-C in sterilizing bioaerosols.
Chemical Fogging
Chemicals with disinfecting properties interact or react with microbes and viruses to deactivate them by reacting with important components of the cells (Organization, 2020a, 2020b). The EPA has compiled a list of chemical disinfectants thought to be effective at deactivating SARS- CoV-2 (Agency, 2020a, 2020c). These disinfectants have either shown efficacy at disinfecting hard-to-kill viruses or at deactivating similar coronaviruses. While most of these chemicals are approved for fomite disinfection purposes, businesses, public offices, and other spaces have also been using chemical disinfectants for fogging purposes to fight the spread of COVID-19 (Johnson, 2020; Page, 2020; Sidman, 2020).
Fogging machines are a controversial technology used to target bioaerosols and droplets. Fogging machines, or foggers, emit aerosolized disinfectant to deactivate bioaerosols (Montazeri et al., 2017). While disinfectant foggers are extremely effective at reaching and deactivating bacteria and viruses, many of the fogging chemicals have not been approved by the EPA for human exposure and thus pose a safety risk (Agency, 2020b). There have been many reports of adverse health effects linked to the use of fogging and aerosolized disinfectants. When fogging machines were used in ambulances in New Jersey in 2009, paramedics in the ambulances complained of nausea, migraines, eye and skin irritation, and more (Fair, 2019). When HDQ Neutral, an ammonium-based disinfectant, was sprayed in U.S. Immigration and Customs Enforcement detention centers to prevent spread of SARS-CoV-2, detainees complained of skin irritation and bleeding, nose bleeds, fainting, respiratory failure, and nausea and 11 detainees fell severely ill (López, 2020). Furthermore, the CDC currently does not recommend the use of disinfecting fogging applications, and states that newer fogging technologies, such as ozone mists and vaporized hydrogen peroxide, require more research before a recommendation on newer fogging technologies can be made (CDC, 2020a).
Literature Review: PPE
In shared indoor spaces, PPE should be used to minimize SARS-CoV-2 transmission. In a campus environment, universities, and schools (including JHU) have emphasized and often required personnel to wear masks before entering any store or classroom. It is critical to keep in mind that PPE is meant to be used as the last resort protection from any sort of aerosolized infection and other measures such as social distancing and ventilation controls should be prioritized (CDC, 2020b).
The two masks that are most commonly worn in public are homemade cloth masks and disposable masks. Home- made masks are not considered traditional PPE because of the wide range of differences between homemade masks involving fabric, cloth density, and thread size (for Immunization and of Viral Diseases, 2020). Homemade masks, if not used correctly, can actually be detrimental as they can give people a false sense of security, making them more likely to come in contact with others while providing only limited protection (Rengasamy et al., 2010). Homemade masks are reported to be most useful against particles about 10 µm in size CDC (2020b). Slightly larger than most aerosols, these particles tend to hang in the air for about 10 minutes before gravity pulls them to the ground. Particles substantially larger than 10 µm such as 100 µm particles settle to the ground in several seconds and cloth masks can filter these very effectively. Particles smaller than 10µm, typical for SARS- CoV-2 aerosols, have the potential of diffusing through cloth masks. More research is needed, specifically pertaining to the SARS-CoV-2 virus and its bioaerosol properties, to deter- mine the efficacy of cloth masks for this aerosolized SARS-CoV-2.
Correct mask usage is critical for maximizing efficacy. Masks are meant to be worn to cover the mouth and nose; gaps in the fit of the mask around the nose and mouth can cause over a 60% decrease in mask efficiency (Konda et al., 2020). Instructing faculty and students about proper mask usage through engaging public awareness campaigns will likely increase the efficiency of masks and decrease transmission risk.
There are various factors that make some masks more effective at filtering virus particles than others. Tests with polydisperse sodium chloride aerosols determined that surgical and cloth masks on average provide a 10-50% protection against aerosols similarly sized to those of SARS- CoV-2 (Rengasamy et al., 2010). Studies have also concluded that using multiple layers of masks is more effective than a singular layer. The thread count of the mask plays an important role in filtration efficiency, with masks containing a higher density of threads having greater filtration properties (Konda et al., 2020). By using an effective mask and learning about proper methods of mask usage, the risk of SARS-CoV-2 aerosol transmission can be reduced in classrooms.
DISCUSSION
Airflow
The authors hypothesized that novel CFD analyses of class- rooms could lead to feasible aerosol mitigation solutions. In the scenarios tested within the classrooms, CDC social distancing guidelines were followed in almost every scenario (CDC, 2020b). In other words, individuals were largely modeled at least 1.8 m apart from each other. Despite this, the exhalation of each individual spread widely through- out the room. In order to minimize any given individual’s exposure to SARS-CoV-2 aerosols, the individual must avoid areas of a room where the exhaled air of others repeatedly circulates (which results in high particle density). Analysis of airflow patterns in the mid-sized classroom showed that air particles tended to get trapped in the corners of the room due to the shape of the room and the overhead vent placement. When comparing all scenarios tested, opening more doors and windows allowed this trapped air to exit the room and fresh air to recirculate. When introducing a portable AP into the room, the purifier with directed flow was significantly better at dispersing the filtered air more broadly and evenly throughout the room, especially when placed alongside the wall. This placement also decreases the density of contaminated air around each individual student. On the other hand, the radial-flow AP expels clean air directly upward with minimal horizontal velocity. The clean air eventually falls to the ground where it is picked up by the AP once again. This pattern creates an area of high particle density adjacent to the purifier that prevents much of the students’ exhaled air from circulating out of the room. Some general conclusions can be drawn from this analysis. First, opening doors and windows increases air circulation and decreases cross contamination in all cases. Second, air particles tend to get trapped in empty corners of the room or along walls, so individuals should avoid standing in those areas for prolonged periods of time. Third, directed-flow APs are preferable as they circulate clean air throughout the room better than radial-flow ones that eject air upwards. Fourth, APs should be placed in open spaces to minimize interference of the clean air flow. Fifth, directed-flow APs achieve the best overall room air circulation when placed alongside walls, as high-density particle zones along the walls and in the corners are reached by the clean air flow.
Minimizing aerosol transmission in a larger lecture hall can be done by strategically manipulating class size and seating positions. From the airflow analysis, several areas of high air density and poor circulation are highlighted. In particular, the edges of the auditorium along the walls and the front center of the room where the outflow vents are located are areas of high particle density. Therefore, students should avoid sitting at the edges of the room near the walls and the professor should be stationed off-center to mitigate exposure to the students’ exhaled air. Based on the data, a possible formation that shows promise is concentric circles of occupants, which reduces cross contamination and alleviates the high-density zones (Figure 33). The following key assumptions were made when creating these models:

Figure 33. Possible seating chart for this auditorium, designed to limit the amount of expired air that flows directly between students. Seats with the yellow marker representing ideal seats. The goal is to seat students in a ring around the central region of the lecture hall and limit the number of students in that central region where the cross contamination is most concentrated as depicted in Figure 31.
Results are purely qualitative; particle flow changes are not quantified.
Aerosols do not change the behavior of air. Air is incompressible with uniform density at 1.196kg/m3 and uniform viscosity at 1.529*10−5m2/s.
The AP exchange rate is constant at 0.06 m3/s, as determined by averaging common models sold online.
All students and the professor are speaking at 1m/s velocity and no one is wearing a mask (describing the hypothetical “worst-case” scenario). Likewise, the direction of air flow when exhaling is normal to the front of an individual (masks might distort the initial direction of airflow).
Students and professors only face one direction when exhaling. These models do not account for bodily movement.
Air from the HVAC system is clean and not recirculated.
These assumptions certainly impact the results as they decrease the external validity of the findings to a degree. Therefore, these conclusions are deliberately general. Despite this, they remain credible and are consistent with references from the literature involving similar studies. Areas of overlap between this original research and related publications include assumptions about particle characteristics, cuboidal figure approximations, turbulence model utilization, and mathematical force exclusions (Inthavong, 2020; Tang et al., 2013; Tian et al., 2007). Given that CFD requires highly specific settings to achieve great accuracy, there is a multitude of variables that future research could alter. Validity could be improved through more accurate approximations of SARS-CoV-2 aerosol behavior, higher resolution meshing, and more accurate modeling of human figures and breathing patterns. Each of these changes, however, will require greater computing power and may sacrifice precision depending on the assumptions made. Additionally, future research could attempt to quantify airflow trends to clarify differences between simulations. The scenarios featured in this paper serve as a necessary foundation for those explorations, as well as a meaningful contribution towards classroom planning, as the need to account for SARS-CoV-2 aerosol transmission becomes more pressing.
Filters and Ventilation
In buildings where air is recirculated, HEPA filters should be used in HVAC systems when possible. If not possible, filters should be upgraded to the highest MERV rating possible. In smaller rooms with poor ventilation or high rates of air recirculation, scaled-to-size portable HEPA APs should be implemented. In shared spaces with windows and doors, windows and doors should be opened whenever the weather permits.
Temperature and Humidity
In classroom spaces, humidity and temperature are usually regulated to some extent by building HVAC systems. While it may be unreasonable to recommend that temperatures be set as high as possible for the sake of virus deactivation, caution should be taken when lowering temperatures in classrooms. Meanwhile, the lack of consensus on the optimal humidity for minimizing SARS-CoV-2 aerosol spread makes it unreasonable to make a recommendation regarding humidity regulation.
Disinfection/Sanitization
UVGI Usage
While upper-room UVGI technology has demonstrated effi- cacy in various settings, there are many factors to consider. In order for upper-room UVGI to be effective, contaminated air in the inhabited lower-room must flow to or mix with upper-room portions. Thus, this technology’s efficacy is dependent on air-flow patterns in rooms and is most effective when there is floor to ceiling air mixing (Memarzadeh et al., 2010). Fans that encourage mixing between lower and upper room zones will increase the efficacy of this technology, although fans could have the added effect of creating more cross-contamination of airflow between occupants in the room. Additionally, air-flow velocity must be low enough to ensure that bioaerosols are exposed to UVGI for a sufficient amount of time to disable the virus. The time needed for a virus to be in contact with UV-C light depends on how far away the virus-containing aerosol is from the source of UVGI. While there is little data available outlining the minimum time SARS-CoV-2 aerosols should spend in upper-room portions to attain sterilization, data from other airborne diseases suggests that UVGI could be effective at reducing SARS-CoV-2 aerosol activity. Real-time bioaerosol monitors could be installed to test the efficacy of UVGI installations (Su et al., 2017). When used properly, upper-room UVGI techniques can increase circulation of clean air and supplement weaker ventilation systems. However, the conditions above must be met for the technology to be effective, and even so, the extent of the technology’s effectiveness is not known. Other measures, such as wearing PPE, social distancing, engineering controls, and implementing APs, should be implemented before considering an upper-room GUV.
Overhead and standing UVGI lamps are a relatively feasible solution for sanitizing unoccupied common spaces between occupancies. The biggest consideration would be to prevent misuse and to ensure that the room is unoccupied when UVGI lights are on.
Exposure to Visible Light
Given the efficacy of visible light in disabling pathogenic particles, it is recommended that windows and blinds are opened to allow natural sunlight into the room whenever possible. Outdoor instruction is also encouraged as the risk of aerosol transmission in outdoor environments significantly decreases.
Chemical Fogging
Because of the health risks that fogging machines pose, they should only be used if aerosolized chemicals can almost entirely be removed before occupancy. As it is difficult to ensure that later occupants will not breathe fogged chemicals, and as air may be recirculated in many college buildings, fogging machines will likely pose more harm than benefit and should not be used.
PPE
The key factor in mask wearing is correct usage. Though mandating masks is a solution more tailored towards droplet transmission prevention, masks can also capture a portion of SARS-CoV-2 aerosols. In addition, using masks will aid in limiting the outflow velocity and density of individuals’ exhalations, which helps to minimize aerosol spread. Though PPE is used as a last barrier to transmission, it is still effective in mitigating aerosol transmission in a classroom setting.
Final Remarks
To determine the best practices for minimizing aerosol trans- mission in classroom spaces, this group examined how airflow patterns, ventilation, sanitization, temperature and humidity, and PPE affect SARS-CoV-2 aerosol transmission. The authors originally hypothesized that novel CFD class- room analyses could reveal aerosol mitigation solutions and that a thorough literature review could illuminate feasible ventilation solutions, temperature and humidity solutions, dis- infection solutions, and PPE solutions to mitigate aerosol transmission. Though most of the hypotheses were validated, no clear conclusion could be drawn based regarding temperature and humidity solutions. After original air- flow modeling research and review of literature, the following solutions are proposed: 1) maintain a staggered formation in mid-sized classrooms similar to the one analyzed, 2) maintain a formation of staggered rows of concentric circles in semi-circular lecture halls similar to the one analyzed, 3) avoid high-risk zones determined in the airflow analyses, 4) strategically install portable air filters in rooms with poor ventilation, 5) upgrade HVAC filters to the highest MERV rating possible, 6) use UVGI solutions appropriately to disinfect rooms, 7) open windows, doors, and blinds whenever possible, and 8) ensure correct usage of masks. When implemented concertedly, research indicates that these solutions can reduce the risk of SARS-CoV-2 aerosol transmission in classrooms. Furthermore, a majority of this study’s research and proposed solutions is applicable to enclosed spaces of different varieties. Future research should examine airflow patterns in additional classroom scenarios as well as other indoor spaces, and literature review could incorporate more SARS-CoV-2-specific research as the virus is increasingly studied. Nonetheless, this paper builds an important foundation and highlights an important issue. Through the recommendations laid out in this paper, the risk of SARS-CoV-2 aerosol transmission to individuals in classroom spaces, a risk not adequately addressed by current mitigation practices, can be significantly reduced.
ACKNOWLEDGEMENTS
The authors would like to thank Dr. Eileen Haase in the Biomedical Engineering department at JHU for sponsoring this project and for her wisdom and guidance. The authors would also like to thank Dr. Ana Rule, Dr. Peter DeCarlo, and Dr. Lesliam Quirós-Alcalá from the Environmental Health and Engineering department at JHU and Dr. Rajat Mittal from the Mechanical Engineering department at JHU for their expertise and mentorship throughout the authors’ research process. Andrea Zhu and Oren Wei contributed equally and should be considered the primary co-authors of this paper.
CONFLICTS OF INTEREST
The authors declare no conflicts of interest.
REFERENCES
Abuhegazy, M., Talaat, K., Anderoglu, O. and Poroseva, S. (2020). Numerical investigation of aerosol transport in a classroom with relevance to COVID-19. Physics of Fluids, 32(10), 103311-103312.
Agency, U. E. P. (2018a). Guide to air cleaners in the home. (2nd ed.). Agency, U. E. P. (2018b). Residential air cleaners: A technical summary, 3rd ed.. Retrieved from https://www.epa.gov/sites/production/ files/2018-07/documents/residential_air_cleaners_-_a_technical_summary_3rd_edition.pdf
Agency, U. E. P. (2020a). How does EPA know that the products on list N work on SARS-CoV-2?,. Retrieved from https://www.epa.gov/ coronavirus/how-does-epa-know-products-list-n-work-sars-cov-2
Agency, U. E. P. (2020b). Retrieved from https://www.epa.gov/coronavirus/ can-i-use-fumigation-or-wide-area-spraying-help-control-covid-19
Agency, U. E. P. (2020c). Retrieved from https://www.epa.gov/pesticide-registration/list-n-disinfectants-use-against-sars-cov-2-covid-19
Anderson, E., Turnham, P., Griffin, J. and Clarke, C. (2020). (Vol. 40). Retrieved from https://doi.org/10.1111/risa.13500
ASHRAE. (2013). HVAC design manual for hospitals and clinics, 2nd ed.. Atlanta, GA: American Society of Heating Refrigerating and Air- Conditioning Engineers Inc.
Association, N. A. F. (2020). COVID-19 (Corona Virus) and air filtration frequently asked questions (FAQs).,. Retrieved from https://www.nafahq.org/covid-19-corona-virus-and-air-filtration-frequently-asked-questions-faqs/#What%20about%20portable%20air%20cleaners
Azimi, P., Zhao, D. and Stephens, B. (2014). Estimates of HVAC filtration efficiency for fine and ultrafine particles of outdoor origin. Atmospheric Environment, 98, 337-346.
Casanova, L., Jeon, S., Rutala, W., Weber, D. and Sobsey, M. (2010). Effects of air temperature and relative humidity on coronavirus survival on surfaces. Applied and Environmental Microbiology, 76(9), 2712- 2717.
CDC. (2020a). Chemical disinfectants.,. Retrieved from https://www.cdc.gov/infectioncontrol/guidelines/disinfection/disinfection-methods/ chemical.html#Hydrogen
CDC. (2020b). How to protect yourself & others.,. Retrieved from https://www.cdc.gov/coronavirus/2019-ncov/prevent-getting-sick/ prevention.html?CDC_AA_refVal=https%3A//www.cdc.gov/ coronavirus/2019-ncov/prepare/prevention.html
Dai, T., Gupta, A., Murray, C., Vrahas, M., Tegos, G. and Hamblin, M. (2012). Blue light for infectious diseases: Propionibacterium acnes, Helicobacter pylori, and beyond? Drug Resistance Updates: Reviews and Commentaries in Antimicrobial and Anticancer Chemotherapy, 15(4), 223-236.
Enwemeka, C., Bumah, V. and Mason-Meyes, D. (2020). Light as a potential treatment for pandemic coronavirus infections: A perspective. Journal of Photochemistry and Photobiology B, 207, 111891-111891.
Escombe, A., Moore, D., Gilman, R., Navincopa, M., Ticona, E., Mitchell, B., Noakes, C., Martínez, C., Sheen, P., Ramirez, R., Quino, W., Gonzales, A., Friedland, J. and Evans, C. (2009). Upper-room ultraviolet light and negative air ionization to prevent tuberculosis transmission. PLoS Med, 6(3).
Fair, M. (2019). EMS Workers in a Fog Over Disinfectant Feared Danger,. Nj. Retrieved from https://www.nj.com/mercer/2010/12/ems_workers_in_a_fog_over_disi.html
Guo, Z., Wang, Z., Zhang, S., Li, X., Li, L., Li, C., Cui, Y., Fu, R., Dong, Y., Chi, X., Zhang, M., Liu, K., Cao, C., Liu, B., Zhang, K., Gao, Y., Lu, B. and Chen, W. (2020). Aerosol and surface distribution of severe acute respiratory syndrome coronavirus 2 in hospital wards. Emerging Infectious Diseases, 26(7), 1583-1591.
Hamner, L., Dubbel, P., Capron, I., Ross, A., Jordan, A., Lee, J., Lynn, J., Ball, A., Narwal, S., Russell, S., Patrick, D. and Leibrand, H. (2020). High SARS-CoV-2 attack rate following exposure at a choir practice- Skagit County. Morbidity and Mortality Weekly Report, 69(19), 606- 610.
Ijaz, M., Brunner, A., Sattar, S., Nair, R. and Johnson-Lussenburg, C. (1985). Survival characteristics of airborne human coronavirus 229E. The Journal of General Virology, 66(12), 2743-2748.
Inthavong, K. (2020). (Vol. 2). Retrieved from https://doi.org/10.1007/s42757-019-0046-6
Johnson, B. (2020). Local business using fog treatment to fight COVID-19 at courthouse, other facilities. EastIdahoNews.com.
Jones, R., and Brosseau, L. (2015). Aerosol transmission of infectious disease. Journal of Occupational and Environmental Medicine, 57(5), 501-508.
Kim, S., Ramakrishnan, M., Raynor, P. and Goyal, S. (2007). Effects of humidity and other factors on the generation and sampling of a coronavirus aerosol. Aerobiologia, 23(4), 239-248.
Konda, A., Prakash, A., Moss, G., Schmoldt, M., Grant, G. and Guha, S. (2020). Aerosol filtration efficiency of common fabrics used in respiratory cloth mask. ACS Nano, 14(5), 6339-6347.
Liu, Y., Ning, Z., Chen, Y., Guo, M., Liu, Y., Gali, N., Sun, L., Duan, Y., Cai, J., Westerdahl, D., Liu, X., Xu, K., Ho, K., Kan, H., Fu, Q. and Lan, K. (2020). Aerodynamic analysis of SARS-CoV-2 in two Wuhan hospitals. Nature, 582, 557-560.
López, C. (2020). Retrieved from https://www.insider.com/report-detention-centers-use-disinfectant-causing-bleeding-and-pain-2020-6
Lu, J., Gu, J., Li, K., Xu, C., Su, W., Lai, Z., Zhou, D., Yu, C., Xu, B. and Yang, Y. (2020). COVID-19 Outbreak associated with air conditioning in restaurant. Emerging Infectious Diseases, 26(7).
Lytle, C., and Sagripanti, J. (2005). Predicted inactivation of viruses of relevance to biodefense by solar radiation. Journal of Virology, 79(22), 14244-14252.
Mcdevitt, J., Rudnick, S. and Radonovich, L. (2012). Aerosol susceptibility of influenza virus to UV-C light. Applied and Environmental Microbiology, 78(6), 1666-1669.
Memarzadeh, F., Olmsted, R. and Bartley, J. (2010). Applications of ultraviolet germicidal irradiation disinfection in health care facilities: effective adjunct, but not stand-alone technology. American Journal of Infection Control, 38(5), 13-24.
Mittal, R., Ni, . R. and Seo, J. (2020). The flow physics of COVID-19. Journal of Fluid Mechanics, 894, 2-3.
Montazeri, N., Manuel, C., Moorman, E., Khatiwada, J., Williams, L. and Jaykus, L. (2017). Virucidal activity of fogged chlorine dioxide- and hydrogen peroxide-based disinfectants against human norovirus and its surrogate, feline calicivirus, on hard-to-reach surfaces. Frontiers in Microbiology, 8(1031), 1-9.
Morawska, L., and Milton, D. (2020). It is time to address airborne transmission of COVID-19. Clinical Infectious Diseases, 71(9), 2311- 2313.
Morawska, L., Tang, J., Bahnfleth, W., Bluyssen, P., Boierstra, A., Buonanno, G., Cao, J., Dancer, S., Floto, A., Franchimon, F., Haworth, C., Hogeling, J., Isaxon, C., Jiminez, J., Kurnitski, J., Li, Y., Loomans, M., Marks, G. and Yao, M. (2020). (Vol. 142). Retrieved from https://doi.org/10.1016/j.envint.2020.105832
Ong, S., Tan, Y., Chia, P., Lee, T., Ng, O., Wong, M. and Marimuthu, K. (2020). Air, surface environmental, and personal protective equipment contamination by severe acute respiratory syndrome coronavirus 2 (SARS-CoV-2) from a symptomatic patient. Journal of the American Medical Association, 323(16).
Organization, W. H. (2020a). Coronavirus disease (COVID-19) situation report - 168.,. Retrieved from https://www.who.int/docs/default-source/ coronaviruse/situation-reports/20200706-covid-19-sitrep-168.pdf?sfvrsn=7fed5c0b_2
Organization, W. H. (2020b). Novel Coronavirus (2019n-CoV) situation report - 1.,. Retrieved from https://www.who.int/docs/default-source/ coronaviruse/situation-reports/20200121-sitrep-1-2019-ncov.pdf?sfvrsn=20a99c10_4
Page, E. (2020). Retrieved from https://www.nbcsandiego.com/news/local/ chemical-fogger-now-fighting-covid-mts/2317123/
Papineni, R., and Rosenthal, F. (1997). The size distribution of droplets in the exhaled breath of healthy human subjects. Journal of Aerosol Medicine, 10(2), 105-116.
Perry, J., Agui, J. and Vijayakimar, R. (2016). Retrieved from https://ntrs.nasa.gov/citations/20170005166
Rengasamy, S., Eimer, B. and Shaffer, R. (2010). (Vol. 54). Retrieved from https://doi.org/10.1093/annhyg/meq044
Schuit, M., Ratnesar-Shumate, S., Yolitz, J., Williams, G., Weaver, W., Green, B., Miller, B., Krause, M., Beck, K., Wood, S., Holland, B., Bohannon, J., Freeburger, D., Hooper, I., Biryukov, J., Altamura, L., Wahl, V., Hevey, M. and Dabisch, P. (2020). Airborne SARS-CoV-2 is rapidly inactivated by simulated sunlight. The Journal of Infectious Diseases, 222(4).
Sidman, J. (2020). Restaurants are using a virus-killing fogging agent as an extra precaution against covid-19. Washingtonian.
Song, J., and Meng, X. (2015). The improvement of ventilation design in school buildings using CFD simulation. Procedia Engineering, 121, 1475-1481.
Su, C., Lau, J. and Yu, F. (2017). A case study of upper-room UVGI in densely-occupied elementary classrooms by real-time fluorescent bioaerosol measurements. International Journal of Environmental Research and Public Health, 14(1).
Tang, J., Nicolle, A., Klettner, C., Pantelic, J., Wang, L., Suhaimi, A., Tan, A. Y., Ong, G., Su, R., Sekhar, C., Cheong, D. and Tham, K. (2013). Airflow dynamics of human jets: Sneezing and breathing - potential sources of infectious aerosols. PloS one, 8(4).
Tellier, R., Li, Y., Cowling, B. and Tang, J. (2019). Recognition of aerosol transmission of infectious agents: a commentary. BMC Infectious Diseases, 19(1).
Tian, Z., Tu, J. and Yeoh, G. (2007). CFD studies of indoor airflow and contaminant particle transportation. Particulate Science and Technology, 25(6).
Wang, J., and Du, G. (2020). COVID-19 may transmit through aerosol. Irish Journal of Medical Science, 1-2.
Wells, W. (1934). On air-borne infection: Study II. Droplets and droplet nuclei. American Journal of Epidemiology, 20(3).
Zhang, R., Li, Y., Zhang, A., Wang, Y. and Molina, M. (2020). Identifying airborne transmission as the dominant route for the spread of COVID-19. Proceedings of the National Academy of Sciences, 117(26), 14857- 14863.
Zhao, B., Liu, Y. and Chen, C. (2020). (Vol. 177). Retrieved from https:// doi.org/10.1016/j.buildenv.2020.106918