

JOSSELYN LORENA MATA CALIDONIO
Department of Physics and Engineering, Eastern Nazarene College, 23 East Elm Avenue, Quincy, MA 02170, USA
ABSTRACT
Tremors can be described as involuntary and uncontrollable movements of parts of the body. They are classified based on characteristics like frequency, amplitude and activation. Such parameters are essential to identify so that better treatment can be provided to patients suffering from tremor conditions. Electromyography (EMG) is a diagnostic procedure to assess the health of muscles and motor neurons. Though used in the past, EMG is expensive, invasive, and potentially painful. Therefore, there is a need to create an affordable, fast, painless and effective apparatus that can gather, quantify and classify tremor parameters from patients, resulting in a short list of possible diagnoses which can be narrowed down by a physician. This research aims to create a Tremor Diagnosis Device (TDD) using an accelerometer, Raspberry Pi 4, and Python code. Due to the COVID-19 pandemic, gathering tremor data directly from patients was not possible. Consequently, the tremors were simulated using the PASCO string vibrator. After several test cases, we proved that the TDD measured the correct tremor frequencies and provided a list of diagnoses based on the quantified tremor data, the testing method, and personal information from patients. This research paper describes how the TDD was made and the results of numerous trials using simulated tremor data. We expect this new approach to be further explored on patients so that in the future, it can replace current procedures.
INTRODUCTION
Tremors are involuntary, rhythmic muscle contractions in parts of the body generally caused by a problem in the deep parts of the brain, such as the basal ganglia, that control movement. They are often seen in hands but can also be seen in legs, head, arms, vocal cords, and torso (Charles et al. 1999). Some of the causes for tremors are genetic, others secondary to neurologic disorders, and others are idiopathic. There are different ways to classify tremors, but the two main tremor divisions most relevant to this research are the classification based on tremor activation (resting or action) and the classification based on the tremor’s appearance and origin.
A tremor’s diagnosis is based on the location, activation, and appearance (frequency and amplitude) that the tremor is presented on (Bhatia et al. 2018). Because of its broad classification, making an accurate diagnosis can be difficult. Physicians have tried different methods and equipment, like EMG, to help them make a diagnosis. However, tremor activity through EMG is sometimes recorded using needles and wire electrodes, leading to more invasive and painful procedures (Grimaldi and Manto 2010). In addition to costing several hundreds of dollars, there is evidence that infections, bruising, tingling, soreness, and swelling may result from this procedure (Farrell et al. 2003).
Different technologies have been examined in the past to try to quantify tremors and provide a diagnosis. Smartwatches, for example, were used to try to record tremor activity and distinguish between two different types of tremors (Wile et al. 2014). Similarly, smartphones have also been evaluated for such purposes. The latter involved using three apple-based mobile devices to monitor different settings for 20 minutes (Varghese et al. 2019). Both of the mentioned methodologies are limited to hand tremor analysis, which shows a clear disadvantage when compared to the body-part adaptability of the TDD. In addition, they involve a longer testing time and more expensive equipment, compared to the MPU6050 accelerometer used by the TDD. Consequently, there is a need to create a painless, affordable, fast, and effective apparatus that can detect tremor frequencies and amplitudes based on different parameters like activation for a better diagnostic assessment. This research aims to create a Tremor Diagnosis Device (TDD) using an accelerometer, Raspberry Pi 4, and Python coding. Combining such elements will create a device that can gather frequency and amplitude data from the tremor, connect such results with different parameters like activation method, store this data, and provide a narrow list of possible tremor disorders/diseases associated with the quantified data. With such a list, a physician will be able to give the patient a single, more accurate diagnosis which will lead to a better treatment.
MATERIALS AND METHODS
The hardware needed to develop the TDD includes a Raspberry Pi 4 and its respective charging cord, a touchscreen monitor for the Raspberry Pi, the tri-axial accelerometer MPU6050, cables used to connect the sensor, the PASCO string vibrator, and a function generator with its respecting connection and charging cords.
One can think of the Raspberry Pi 4 as a minicomputer. For the TDD, the Raspberry Pi 4 served the purpose of a CPU along with the EVICIV 7 Touchscreen Monitor. A mousepad and keyboard were attached to the Raspberry Pi to make the coding process faster.
Attached to the Raspberry Pi 4 was the MPU6050 accelerometer. This accelerometer was appropriate for the TDD because it is triaxial, small and light, and can be interfaced with the Raspberry Pi 4. The weight and size of the accelerometer were significant since both could interfere with the tremor’s motion. The MPU6050 provides a digital output with very sensitive readings based on a programmable full-scale range of ±2g, ±4g, ±8g, and ±16g.
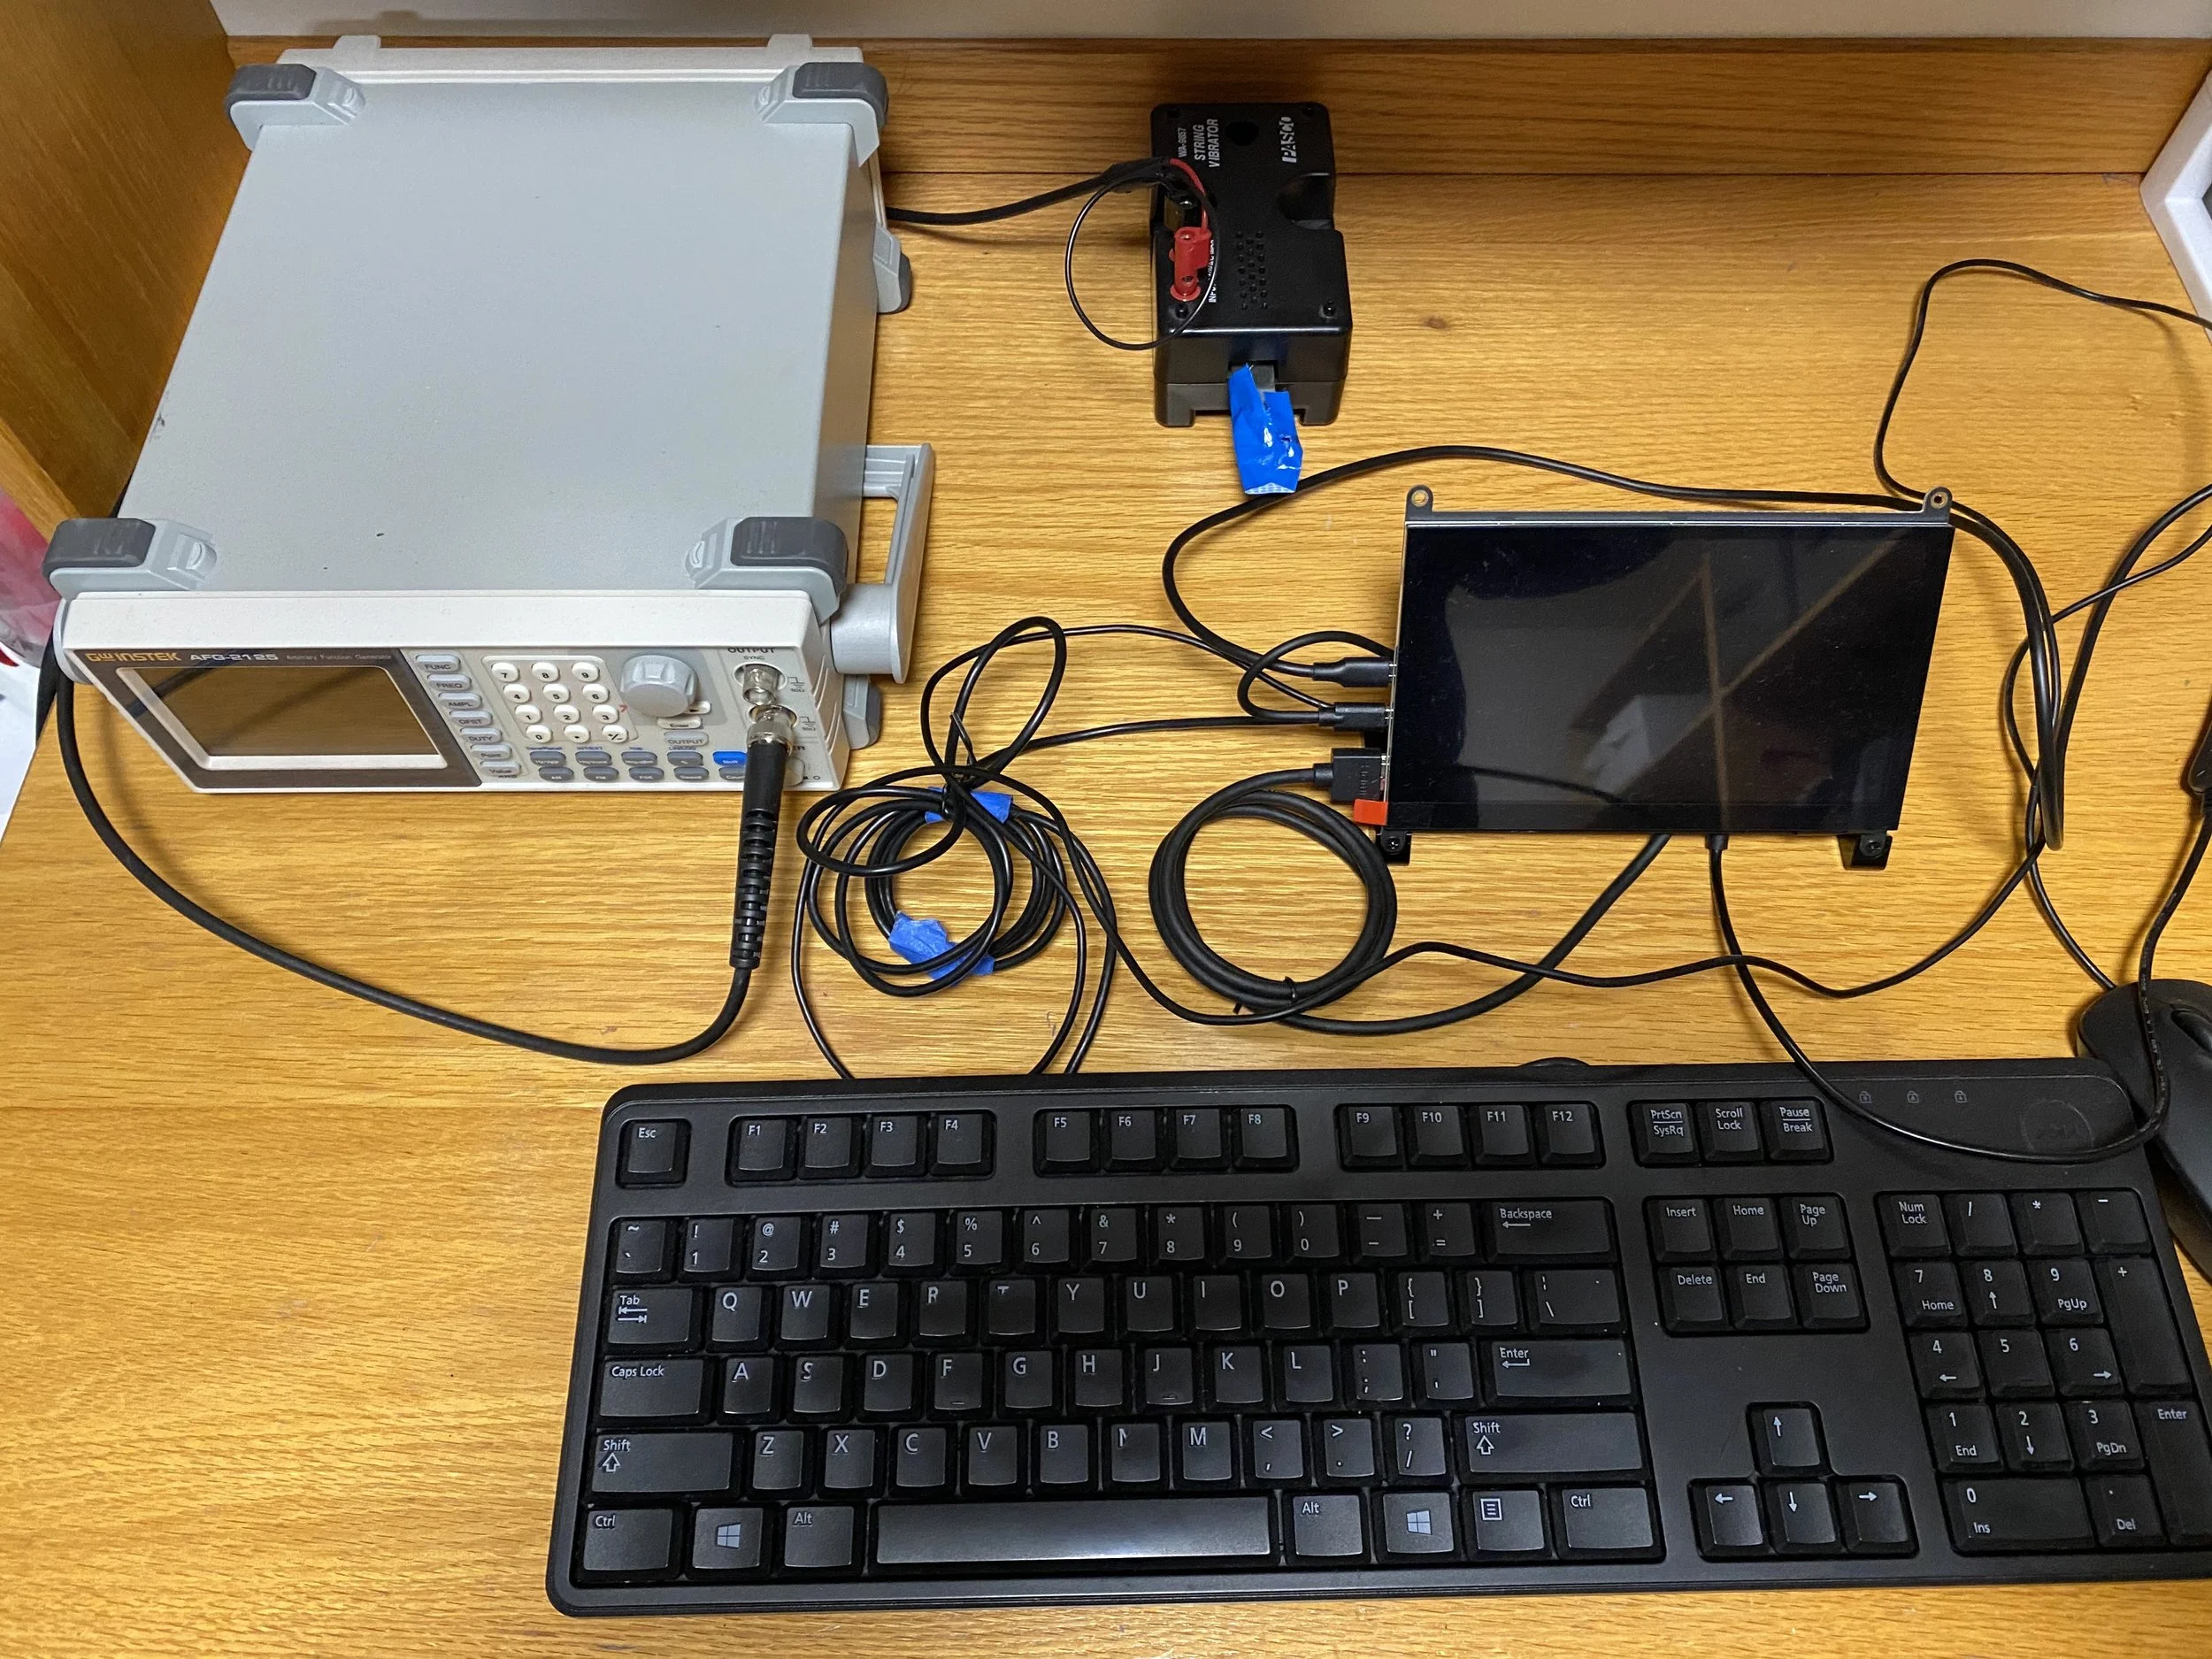
Figure 1. Experimental Setup. A Raspberry Pi 4, along with a monitor and its charging and connection cords, were used to interface with the MPU6050 (not shown) to record frequency and amplitude values of tremors. The PASCO String Vibrator, powered by the Instek AFG-2125 function generator, was used to input frequencies for trial testing.
To ensure the frequency readings’ accuracy and simulate tremors, the TDD used the PASCO string vibrator. String vibrators are usually used to study frequency, wavelength, and resonance. We powered the string vibrator using the Instek AFG-2125 function generator, which allowed us to output a frequency of our choice through the string vibrator. By placing the accelerometer on the string vibrator, the accelerometer moved at a specific frequency which we gathered in our program. As a result, we were able to test the readings of the TDD. Figure 1 shows the different components of the setup, in which we can see the various connections made to ensure that the communication within all the equipment was successful.
In the Raspberry Pi, a Python script was created on the Thonny IDE, which implemented multiple libraries to read and manipulate the data from the sensor. The data are read continuously every 0.01 seconds for a total of 20 seconds. The Fast Fourier Transform (FFT) was used to convert the time signal into individual spectral components. Thus, we obtained the frequency spectrum of the time signal. In addition, through this code, the user was able to input necessary information like name, age, gender, the body part being tested, tremor activation method, and tremor action test. The code included multiple conditional statements that determined which disease or disorder was associated with the specific frequency obtained and test performed. The frequency values for each of the different diagnoses were obtained from a research done by Vanderbilt University School of Medicine for tremor classification (Charles et al. 1999).
Every test using the TDD starts the same. The user inputs their first name, last name, age, gender, and the body part being tested. The user is also able to input which activation method they are using: resting or action activation. Next, they input which action test they are performing: postural action or kinetic/isometric action. The system gives a countdown of 10 seconds for when the system will start recording data. For all the trials performed, the PASCO string vibrator was used to simulate tremors of desired frequencies.
Based on the quantified data received from the sensor and the information input by the user, the TDD can make a narrow list of possible diagnoses that can help a physician evaluate a patient who presents tremors. As shown in Figure 2, the cycle begins with the patient having a specific tremor and ends with the patient having a particular diagnosis. It goes through the different steps of the process, like the tremor quantification, so that a physician can examine the gathered data and assess the patient as best as possible.

Figure 2. Concept of Operation. The system is based on a cycle that starts with a patient presenting a tremor. Information from the patient and tremor is obtained through the different system processes so that a physician can assess a patient with the most accurate diagnosis.
One of the aims of the TDD was to be low in cost. Most of the equipment used for the project was borrowed from the Physics and Engineering Department at Eastern Nazarene College. An approximate total cost can vary, depending on the Raspberry Pi and monitor obtained, but it averages around $170-$200 with the MPU6050 having a price of $4. Since the TDD can be used unlimited times, the total cost for a diagnostic test would be very low.
RESULTS
The TDD provided different results depending on the parameters measured and the activation method selected. For example, when we set a trial to a resting activation method with a 5Hz simulated tremor, the TDD gave the following list of possible diseases/disorders associated with that specific tremor: Essential Tremor, Psychogenic Tremor, and Holmes Tremor. Similarly, when we set a trial to an action activation method, specified as postural action, with a 5Hz simulated tremor, the TDD yielded the following list of possible diseases/disorders associated with that specific tremor: Psychogenic Tremor, Drug and Metabolic Induced Tremor, Holmes Tremor, Alcohol or Drug Withdrawal Tremor, and Physiological Tremor. Though the quantified data were very similar, as shown in Table 1, the results were different because they considered the kind of test performed. With the graphs from both trials of the time and frequency signal, as shown in Figure 3 and Figure 4, we were also able to visually observe the similarities in the quantified data, specifically when noticing the spike at 5Hz on both frequency spectrums. Once the list of possible diagnoses is obtained from a specific test, a physician can interpret the results based on other information like age and gender or other symptoms presented on the patient. The physician can find this information saved in an excel spreadsheet so that the patient’s information and assessment are recorded.

Table 1. Comparison of 5Hz signal results for resting and action activation method. This table shows the frequency and amplitude values extracted from each of the simulated tremors. These data are very similar, yet it yields to different medical conditions because of the activation method through which it was obtained.

Figure 3. Graph of a 5Hz signal for a resting activation method. A 5Hz tremor was simulated using the PASCO string vibrator. The setting for this trial was that of a resting activation method. Data were recorded every 0.01 seconds for 20 seconds total. As seen on the frequency graph, there is a spike at 5Hz, which shows that our system is recording the correct values.

Figure 4. Graph of a 5Hz signal for an action activation method. A 5Hz tremor was simulated using the PASCO string vibrator. The setting for this trial was that of an action activation method with a postural action test. Data were recorded every 0.01 seconds for 20 seconds total. As seen on the frequency graph, there is a spike at 5Hz, which shows that our system is recording the correct values.
In addition to simulating a tremor with a frequency of 5Hz, we simulated tremors with higher and lower frequencies. For example, when performing an action test specified to be kinetic of an 8Hz simulated tremor, the tremor-induced conditions were Psychogenic Tremor and Holmes Tremor only. Once again, the time graph and frequency spectrum, as shown in Figure 5, allowed us to visually verify our frequency readings’ accuracy and analyze this quantified parameter visually.

Figure 5. Graph of an 8Hz signal for an action activation method. An 8Hz tremor was simulated using the PASCO string vibrator. The setting for this trial was that of an action activation method with a kinetic/isometric action test. Data were recorded every 0.01 seconds for 20 seconds total. As seen on the frequency graph, there is a spike at 8Hz, which shows that our system is recording the correct values.
DISCUSSION
Tremors are a very common symptom of medical conditions, especially for those involving a neurological defect. Given that there is no established standard test to classify and denote tremor type, evaluating the condition can be challenging (Crawford and Zimmerman 2018). The TDD aimed to solve this problem by providing a narrow list of possible diagnoses based on the frequency and the testing specifications of the tremor. Once testing is performed in actual patients, a physician may use the TDD as a rapid and effective method for tremor diagnosis and condition evaluation.
One of the primary scopes of this project was to make the TDD noninvasive, cost-effective, fast, and of easy usage. The cost of the TDD was minimum in comparison to the use that it will be given. One test does not take longer than one minute, ensuring that the physician can almost immediately get the test results. It does not involve any invasive procedure, like using needles or electrodes, making it safer for the patient. Lastly, the system is not complex, making it user-friendly. Besides answering the initial questions on their personal information, the user is not required to perform any additional steps to set up the system.
CONCLUSIONS
Numerous trials were performed, varying the input frequency and the type of activation and action test. We were able to see the different diagnoses based on the specified conditions and quantified results. Among the main advantages of the TDD, we see that the procedure required no invasive mechanism to obtain results, which were obtained in less than one minute.
This research is limited to results obtained from simulated signals that may significantly differ from the actual signals received from a patient’s tremor. The TDD was not able to be tested with real patients because of the COVID-19 pandemic. All the results are obtained from simulated tremors created by the PASCO string vibrator, therefore the signal received would be less noisy than that of an actual patient’s tremor. However, since the proof-of-concept still stands, more tests need to be performed in the future to thoroughly evaluate the effectiveness of the device. To begin with, the TDD needs to be tested on patients with a known diagnosis. This kind of test will help determine how accurate the list of possible diagnoses presented by the TDD is. Once these tests are performed, additional sensitivity and specificity analyses should be completed. At last, once the TDD shows its promising potential towards tremor diagnosis, clinical studies should be performed to finalize the TDD’s performance analysis.
CONFLICTS OF INTEREST/DISCLOSURE
The author declares no conflicts of interest.
ACKNOWLEDGMENTS
First and foremost, I praise and thank God for granting me the opportunity and knowledge to carry out this experiment. I thank my family and friends for their unconditional support. I also thank Eastern Nazarene College for providing the resources and facilities to carry out this project. Last, but most definitely not least, I thank Dr. Pierre-Richard Cornely for his guidance and advice throughout the development of the project.
REFERENCES
Charles, P., Esper, G., Davis, T., Maciunas, R. and Robertson, D. (1999) ‘Classification of tremor and update on treatment’, American Family Physician, 59(6), 1565-1572.
Hess, C. and Pullman, S. (2012) ‘Tremor: Clinical phenomenology and Assessment Techniques’, Tremor and Other Hyperkinetic Movements (New York, N.Y.), 2, tre-02-65-365-1, available: http://doi.org/10.7916/D8WM1C41.
Bhatia, K., Bain, P., Bajaj, N., Elble, R., Hallett, M., Louis, E., Raethjen, J., Stamelou, M., Testa, C., Deuschl, G. and Tremor Task Force of the International Parkinson and Movement Disorder Society. (2018) "Consensus Statement on the classification of tremors. from the task force on tremor of the International Parkinson and Movement Disorder Society", Movement Disorders: official journal of the Movement Disorder Society, 33(1), 75-87, available: http://doi.org/10.1002/mds.27121.
Grimaldi, G. and Manto, M. (2010) ‘Neurological Tremor: Sensors, Signal Processing and Emerging Applications’, Sensors, 10(2), 1399-1422, available: http://doi.org/10.3390/s100201399.
Farrell, C., Rubin, D., and Haidukewych, G. (2003) ‘Acute compartment syndrome of the leg following diagnostic electromyography’, Muscle & Nerve, 27(3), 374-377, available: https://doi.org/10.1002/mus.10328.
Crawford, P. and Zimmerman, E. (2018) ‘Tremor: Sorting Through the Differential Diagnosis’, American Family Physician, 97(3), 180-186, available: http://www.aafp.org/afp/2018/0201/p180.html., accessed 21 March 2021.
Wile, D., Ranawaya, R. and Kiss, Z. (2014) ‘Smart watch accelerometry for analysis and diagnosis of tremor’, Journal of Neuroscience Methods, 230, 1-4, available: http://doi.org/10.1016/j.jneumeth.2014.04.021.
Varghese, J., Niewöhner, S., Soto-Rey, I., Schipmann-Miletić, S., Warneke, N., Warnecke, T. and Dugas, M. (2019) ‘A Smart Device System to Identify New Phenotypical Characteristics in Movement Disorders’, Frontiers in Neurology, 10, 96-101, available: http://doi.org/10.3389/fneur.2019.00048.