

Baibhav Tilak and Prof. T. K. Jindal
Department of Aerospace Engineering, Punjab Engineering College, Chandigarh, India
Department of Aerospace Engineering, Punjab Engineering College, Chandigarh, India
ABSTRACT
This paper demonstrates the impact of Co Flow Jets (CFJ) on airfoil performance. CFJ airfoils are an active airfoil performance enhancing method which uses injection and suction on the airfoil leeward side. Our research shows that better lift augmentation, higher stall angle and drag reduction is achieved when the injection point of the jet is located close to the point of maximum thickness. This method provides superior performance compared to passive augmenting methods and can be integrated with unified jet-based lift and thrust systems. We analyzed CFJ airfoils based on NACA 2414 by varying location of injection slots on the airfoil. It is essential to give the basic theory behind the working of this performance improvement methodology and to perform 2-D steady Computational Fluid Dynamics (CFD) simulations of the various CFJ airfoils at low speed. The lift, drag and jet momentum coefficients have been obtained from the CFD data and are used to compare the airfoils in this study. The location of the injection slot location is varied to compare performance.
INTRODUCTION
Over the past decade, there have been a large number of breakthroughs in flow control techniques for airfoil performance. Circulation control (CC) airfoils (Gad-el-Hak, 2001) have been studied for decades with the goal of increasing airfoil lift. However, they require an extra surface, like a flap, to do that. Flow control technology has achieved increased lift, increased stall margin, and reduced drag with low energy expenditure and minimal solid structure device. The introduction of active methods based on jet-blowing or suction on the leeward side (Anders et al., 2004) proved beneficial. The combination of latter two techniques (co-flow jet technology) developed by Zha et al. (2006) has shown promising results through CFD simulations (Zha et al. 2007) and experiments (Dano et al. 2011).

Figure 1. A Typical CFJ Airfoil.
In a typical CFJ airfoil with simultaneous blowing at the leading edge (LE) and suction near the trailing edge (TE), zero net mass flux (ZNMF) works over the leeward-side exterior of the airfoil (Figure 1). The blowing provides energy to the flow and suction near the trailing edge ensured that the flow remains attached to the surface.
The co-flow jet airfoils are defined using the following convention: CFJ4dig-SST-SUC-INJ, where 4dig is the same as NACA 4 digit convention, SST is replaced by the percentage of the distance of suction surface translated downward to the chord length, INJ is replaced by the percentage of the injection slot size to the chord length and SUC is replaced by the percentage of the suction slot size to the chord length. For example, CFJ2414-090-090-010 airfoil has an injection slot height of 0.1% of the chord, a suction surface translation of 0.1% of chord and a suction slot height of 0.9% of the chord. In this paper, the location of suction slot is at 85.4% of the chord from the leading edge and the location of injection slot is varied.
The momentum and pressure at the injection and suction slots produce a reactionary force which needs to be included in the CFD simulation. Using control volume analysis, the reactionary force can be calculated using the flow parameters at the injection and suction slot opening surfaces. However, reactionary forces have been omitted in this paper to calculate lift and drag to study only the effect on the flow field over airfoil. By considering the effects of injection and suction jets on the CFJ airfoil, the total lift and drag on the airfoil can be expressed as:
where, R’x and R’y are the surface integrals of pressure and shear stress in x (drag) and y (lift) direction respectively.

R' is the resultant force on the airfoil due to pressure and shear.
Fx and Fx are the reaction forces due to the mass flow rate and pressure at the injection and suction slots in the x and y direction respectively.
The jet momentum coefficient Cµ is a parameter used to quantify the injection intensity. It is defined as:
where, ṁ is the injection mass flow, v is the injection velocity, ρ and V denote the free stream density and velocity respectively, and S is the planform area of the airfoil.
With tremendous scope and lack of experimental or CFD findings, it would be interesting to observe the behavior of CFJ airfoils as certain geometrical parameters are varied. In this paper, the performance variation of the CFJ airfoil is analysed when the location of blowing over the suction surface is changed in a low speed freestream. The performance of the CFJ airfoils analysed is compared to the performance of the baseline NACA 2414. This kind of research will provide speculations for further work in the optimization and application of CFJ airfoils.
METHODS
Five CFJ airfoils are made based on NACA 2414 by varying injection slot location. All other parameters are kept constant. The airfoil has maximum thickness of 14% of the chord at 33% of the chord length from the LE. The location and size of the suction slot have been kept constant at 85.4% and 0.90% of the chord length respectively. The chord is one meter long and unit span is taken. The locations of the injection point for five CFJ are as follows:
30% chord distance forward of the point of maximum thickness, named minus 30.
20% chord distance forward of the point of maximum thickness, named minus 20.
10% chord distance forward of the point of maximum thickness, named minus 10.
Point of maximum thickness, named zero.
10% chord distance aft of the point of maximum thickness, named plus 10.
CFD Method and Boundary Conditions
The realizable K-ϵ (K-Epsilon) method has been chosen for all the 2-D steady CFD simulations. This CFD model is used to simulate mean flow conditions in turbulent conditions by using turbulent kinetic energy (k) and its dissipation (ϵ). It can capture the mean flow of the complex structures involving rotation, boundary layers under strong adverse pressure gradients, separation and recirculation. The simulations are done in ANSYS FLUENT with the following boundary conditions:
Freestream velocity is taken as 30 m/s at 1 bar, 298 K and 1.225 kg/m^3.
Boundary condition for injection is taken as air at 8000 Pa higher than the total pressure of free stream.
For the suction slot near trailing edge, static pressure is reduced by 80 Pa to capture the mass flow equal to that from the injection slot.
With unit span, the lift coefficient (cl) and drag coefficients (c) and aerodynamic efficiency (n) are respectively calculated as:

where c, ρ, and v is the airfoil chord, freestream density and velocity respectively.

RESULTS
The coefficient of lift has increased with respect to the baseline for all the angle of attacks until stall for all CFJ airfoils (Figure 2a). The slope of Cl with respect to angle of attack (AoA) remains consistent for all configurations. While the stall angle varies for different CFJ airfoil configurations, it always stays equal to or more than the stall angle of baseline NACA 2414. The stall angle first decreases when moving the injection point from LE to the point of maximum thickness, then increases till the injection point is at the point of maximum thickness and then decreases again when it is placed behind the point of maximum thickness. The maximum lift coefficient and stall angle is achieved for each CFJ airfoil when the injection slot is placed at the point of maximum thickness.
The drag coefficients of CFJ airfoils are either equal to or slightly less than that of baseline airfoil (Figure 2b). The drag coefficient at zero AoA is approximately same for all airfoils. The least drag coefficient is achieved by the CFJ airfoil where the injection slot is present at 10% chord distance from the point of maximum thickness, either fore or aft.
The aerodynamic efficiency has also improved as a consequence of change in lift and drag coefficients with best efficiency as high at 298. Significant improvement is observed at high angles of attack.
Jet momentum coefficients, (Cμ), increase with an increase in AoA but tends to decrease after stall (Figure 2c). Maximum jet velocity from injection is obtained when the injection slot is nearest to the LE.
An increase in jet momentum coefficients has been observed when the injection point is present at the point of maximum thickness, which remains unexplained (Figure 2d).
DISCUSSION

Figure 3. Comparison of baseline (above) and minus 30 (below) at 18° AoA.

Figure 4. Comparison of baseline (above) and minus 20 (below) at 18° AoA.
In the quest for aggressive and controllable aerodynamic properties, active flow control based on jet and suction has proved to be far better than any other method. For low speed freestream and smaller jets, this paper shows how the location of the injection slot can change the aerodynamic performance of the CFJ airfoils. The research shows results in lift improvement, stall angle improvement as well as drag reduction, the best performance is achieved when the injection point of the jet is located close to the point of maximum thickness. As a consequence of increased lift and decreased drag coefficient, the aerodynamic efficiency has also improved by a large margin. Maximum lift and stall angle is achieved when the point of injection is present at the point of maximum thickness whereas maximum aerodynamic efficiency and minimum drag is achieved when the injection point is present at the aft-most location among the selected locations. Maximum jet velocity or jet momentum coefficient is achieved when the injection point is closest to the leading edge. The above performance variations are similar to the performance variation trends predicted by Zha et al. (2006, 2006b, 2007, 2007b).

Figure 5. Comparison of baseline (above) and minus 10 (below) at 18° AoA.
When the injection slot is closer to LE, momentum coefficient for the CFJ airfoil is higher because of the point of lowest pressure on the suction surface is closer to LE which helps in increased injection velocity of jet. The jet mixes with the freestream easily due to lower pressure outside the jet opening. However, due to low values of jet parameters, the position of the injection slot, greater distance between the injection and suction slot, and the angle of injection, the injected mass flow is unable to enter the separation region over the suction surface. The injected mass flow travels along the freestream as the separation point is aft the injection (Figure 3).
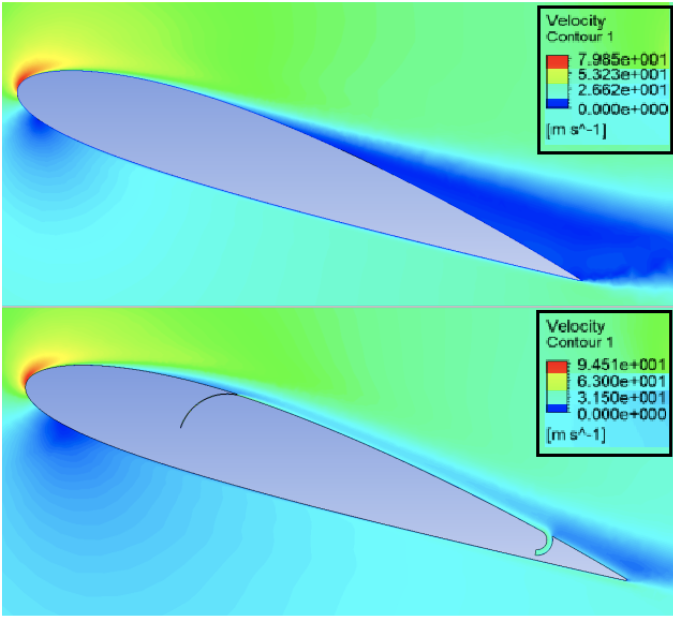
Figure 6. Comparison of baseline (above) and zero (below) at 18° AoA.
The Cu decreases as the injection slot moves closer to the point of max thickness because the dynamic pressure over the suction surface at that point of injection is lower, hence mixing does not take place properly (Figure 4). Similar to the previous case, the separation point is aft of the point of injection. Therefore, the injected mass flow travels along the freestream above the separation region. Due to the above factors and the increased distance of injection point from the suction slot, this configuration stalls sooner than other CFJ airfoil configurations.

Figure 7. Comparison of baseline (above) and plus 10 (below) at 18° AoA.
When the injection slot is closer to but forward of the point of max thickness, the separation point is slightly further than the point of injection (Figure 5). This means that that jet is injected into the separation region leading to controlled separation over the airfoil aft the injection point. Despite the distance of injection point with respect to the suction slot being large, it is able to delay the stall and improve its aerodynamic characteristics.
When the jet is injected at the point of maximum thickness, the reduced distance between the injection and suction slot creates a flow on the suction surface. Here, the injected air is almost completely ingested by the suction slot (Figure 6). This leads to considerable reduction in the thickness of the separation region. Overall this configuration shows the best aerodynamic performance.
As the injection slot is brought even closer to the suction slot, it is possible that complete injected mass flow can be recovered (Figure 7). However, since the injection point is significantly aft of the separation point the mixing of jet with ambient flow is not proper due to low velocity of the jet and the flow over the airfoil at that point. However this separation region is still a lot smaller than that of the baseline airfoil.
It should be noted that for this paper, the lift and drag data are based on the integral of the pressure and shear stress around the airfoil. The data does not include the reaction forces based on mass flow and pressure present at the slots as the main motive is to understand the change in flow field due co-flow jets and suction. CFJs are able to reduce or create an attached flow region inside the separation region, hence improving the performance of the airfoil. If the injection point is present in front of the separation point and the suction at the suction point is not very strong, then the injected flow may separate from the freestream above the separation region. Also, if the injection slot is present aft of the separation point, complete mass flow recovery may happen at the suction slot. The best performance is observed when the injection slot is placed either at the point of max thickness or very close to it. All these performance aspects will change if the strength of the jet or suction is altered. Further, the effect of the CFJ on the pitching moment must be addressed when an application based on CFJ airfoil is thought of. The above findings do not include the three dimensional effects of the flow which will be a significant consideration for aircrafts or wings based on CFJ. Additionally, experimental validation still remains.
This technology has a large scope in providing efficient, compact, unified, and controllable lift-thrust system that can integrate with technologies like Coanda-type Thrust-Augmenting Ejectors.
REFERENCES
Anders, S., Sellers, W.L., and Washburn, A. (2004). Active Flow Control Activities at NASA Langley. 2nd American Institute of Aeronautics and Astronautics Flow Control Conference. Available at: https://doi.org/10.2514/6.2004-2623.
Dano, B. P. E., Zha, G. C., and Castillo, M. (2011). Experimental Study of Co-Flow Jet Airfoil Performance Enhancement using Discrete Jets. 49th American Institute of Aeronautics and Astronautics Aerospace Sciences Meeting. Available at: https://doi.org/10.2514/6.2011-941.
Gad-el-Hak, M. (2001). Flow Control: The Future. American Institute of Aeronautics and Astronautics: Journal of Aircraft, 38(3), 402–418. Available at: https://doi.org/10.2514/2.2785.
Zha, G. C., Paxton, C., Conley, A., Wells, A., and Carroll, B. (2006). Effect of Injection Slot Size on High Performance Co-Flow Jet Airfoil. American Institute of Aeronautics and Astronautics: Journal of Aircraft, 43(4), 987−995. Available at: https://doi.org/10.2514/1.16999.
Zha, G. C., Paxton, D. C., (2006b). A Novel Flow Control Method for Airfoil Performance Enhancement Using Co-Flow Jet. Applications of Circulation Control Technologies. Progress in Astronautics and Aeronautics, American Institute of Aeronautics and Astronautics Book Series, 214(10), 293-314. Available at: https://doi.org/10.2514/4.866838.
Zha, G. C., Carroll, B., Paxton, C., Conley, A., and Wells, A. (2007). High Performance Airfoil with Co-Flow Jet Flow Control. American Institute of Aeronautics and Astronautics: Journal of Aircraft, 45(8), 2087-2090. Available at: https://doi.org/10.2514/1.20926.
Zha, G. C., Gao, W., and Paxton, C. (2007b). Jet Effects on Co-Flow Jet Airfoil Performance. American Institute of Aeronautics and Astronautics Journal of Aircraft, 45(6), 1222-1231. Available at: https://doi.org/10.2514/1.23995.