

Authors: Shannon Stirling, Sudipta Majumdar, Jaeju Ko, and John C. Ford
Institution Information: Department of Chemistry, Indiana University of Pennsylvania, Indiana, PA 15705
ABSTRACT
Mycobacterium tuberculosis causes epidemic levels of tuberculosis each year and more strains of the disease are becoming resistant to the medications used to treat it. Alanine racemase is a convenient target for new drug candidates for tuberculosis as this enzyme is not found in human cells and in M. tuberculosis is only active when in the dimer form. To elucidate the dimerization process, the equilibrium association constants for monomer-dimer equilibrium were determined using high-performance size-exclusion liquid chromatography in a variety of mobile phases. Alanine racemase appeared to be a high-equilibrium association constant dimer in all mobile phases. The degree of dimerization was sensitive to pH and solution composition; phosphate decreases the fraction of alanine racemase dimers. These findings will be useful in designing new antibiotics that target alanine racemases.
INTRODUCTION
Mycobacterium tuberculosis is the species of bacteria responsible for the world-wide epidemic of tuberculosis (TB). A fourth of the world’s population is currently infected and worldwide, there were 1.7 million TB-related deaths in 2016. The World Health Organization has ranked TB as the second-most common infection and the third leading cause of death from a single infectious agent (World Health Organization, 1996). Several antibiotics are currently on the market to treat TB, but multiple strains of the bacterium are becoming resistant to treatment. This problem has become so prevalent that two new classifications of TB have been created, ‘Multidrug-resistant’ and ‘Extensively Drug-resistant’. As resistance continues to increase, the need for new drugs becomes increasingly important. Alanine racemase (ALR), an enzyme essential for the formation of the bacterium’s cell wall, is a viable target for the treatment of TB (Anthony et al., 2011; Azam and Jayaram, 2016).
Alanine racemase is a pyridoxial-5-phosphate (PLP)-dependent protein that converts L-alanine to D-alanine, a necessary component of the cell wall of both Gram-positive and Gram-negative bacteria. The enzyme is found in most bacterial species and there are no known homologs in humans. This key fact has encouraged an array of studies into potential drug candidates targeting ALR (Azam and Jayaram, 2016).
Several known inhibitors of M. tuberculosis ALR (Mt-ALR) work by binding to the substrate-binding site proximal to the bound PLP (Anthony et al., 2011). Among known inhibitors of Mt-ALR, only D-cycloserine, a substrate analog, is used medically to treat TB. However, D-cycloserine carries substantial side effects because it inactivates ALR by binding to the enzyme-bound PLP and PLP-dependent enzymes are essential for many eukaryotic systems. In humans, PLP is important for proper neural functioning. Disruption of PLP binding has led to reports of dizziness, coma, depression, and other neurological and psychotic disorders in D-cycloserine users (Walsh, 2003).
Anthony et al. (2011) have identified new classes of ALR inhibitors by high-throughput screening of 53,000 compounds. Upon analyzing synthetic compound libraries, 472 hits were found, with only 25 strong hits. All of the hits came from the synthetic compound libraries analyzed; their strategy was to select inhibitors that are not substrate analogs. Similarly, to avoid selecting the inhibitors that are substrate analogs, some authors have suggested the inclusion of conserved residues at the entrance to the catalytic pocket of Mt-ALR as additional targets in structure-aided drug design (LeMagueres et al., 2005). Others have suggested designing inhibitors that bind to the dimer interface to block dimerization (Azam and Jayaram, 2016). One of the goals of the current study was to understand the dimerization of ALRs and thus aid in the design of inhibitors, which could serve as drugs, that work by interfering with the dimerization of Mt-ALR.
ALR has long been recognized as a potential target for drug design (Silverman, 1988). While some species show monomeric ALR, most ALR exhibit dimeric forms (Ju et al., 2011). Yokoigawa et al. (2003) first reported a dynamic monomer-dimer equilibrium in the case of ALR from four Shigella species. Ju et al. (2005) showed this to be the case for ALR from Pseudomonas fluorescens as well. More recently, Ju et al. (2011) showed the same for the catabolic or biosynthetic ALRs from five different, Gram-negative bacteria. It has been shown that the ALR from the thermophilic Thermoanaerobacter tengcongensis MB4 has a molecular mass of 76 kDa in solution by size-exclusion chromatography (SEC) while the calculated monomer weight was 46.6 kDa; however, dynamic light scattering gave a hydrodynamic radius which “corresponded to a molecular mass of 110 kDa,” (Xue et al., 2013). Asojo et al. (2014) showed that ALR from a Clostridium difficile strain exists in solution with an apparent molecular mass of 81 kDa, while the calculated dimer would be 87 kDa. These latter two studies (Asojo et al., 2014; Xue et al., 2013) are also consistent with a monomer-dimer equilibrium which favors the dimer.
Pseudomonas fluoresens, T. tengcongensis, and C. difficile are all Gram-negative bacteria. The monomer-dimer equilibrium of ALR appears to also be found in Gram-positive bacteria, as some studies have found a solution molecular mass of 73 kDa by dynamic light scattering for the ALR of the Gram-positive organism Staphylococcus aureus, which has a calculated monomer weight of 42.8 kDa (Scaletti et al., 2012).
Originally, ALRs were classified as either being monomeric enzymes or homodimeric enzymes regardless of species (Yokoigawa et al., 2003). However, it has been proposed that ALRs should be reclassified as either enzymes with low association constants or high association constants for dimerization (Ju et al., 2011). The Ju et al. (2011) study reports the association constants for dimerization of seven ALRs (3 biosynthetic and 4 catabolic). The study also found that Vmax values exhibit a positive correlation with the monomer-dimer association constants. While the active form of Mt-ALR is believed to be a dimer (LeMagueres et al., 2005), Mt-ALR was not included in the Ju et al. study. In this paper, we report the association constant for biosynthetic ALR from M. tuberculosis (Mt-ALR) over a range of pH values and ionic strengths using high-performance size-exclusion chromatography (SEC).
MATERIALS AND METHODS
Materials

The cloning of the Mt-ALR gene as well as the expression and purification of Mt-ALR is (Cook et al., 2018). The sources of the size exclusion chromatography standards are listed in Table 1. All mobile phases were prepared using reagent grade or higher standard components and Type I water.
Instrumentation
All chromatographic experiments were performed on a Prominence HPLC comprised of a Model DGU-20A5 degasser, a Model LC-20AT low pressure quaternary pump, a Model SIL-20AC HT autosampler, a Model CBM-20A communication bus module, and a Model SPD-M20A diode array detector (Shimadzu Scientific Instruments, Columbia, MD). Retention times were taken at the peak maxima, as reported by LCsolutions software (Shimadzu). The injection volume for the ALR samples was 10 μL. The injection volume of the calibration proteins varied from 1 μL to 5 μL, depending on the concentration of the protein.
The experiments were performed on an ENrich SEC 650 column (10x300mm, 24 mL, Bio-Rad Laboratories, Inc., Hercules, CA). The column manufacturer states that the column is stable over the pH range 2-12 (BioRad, n.d.). The column was between 22 and 24°C for all experiments.
Mobile phase preparation
All mobile phases were prepared so that the buffering component was at 50 mM and the NaCl concentration was 100 mM. In the case of mixed buffers, the total concentration of the buffering components was 50 mM. The buffering component was weighed and added to Type 1 water. The appropriate volume of a stock 1 M NaCl solution was added to this solution and the solution brought to final volume. The pH of the mobile phase was adjusted with HCl and NaOH and it was filtered through a 0.45-micron hydrophilic polypropylene filter before use.
Calibration of the size-exclusion column
The column was calibrated in pH 6.0 and 7.0 phosphate mobile phases and in a pH 8.0 mixture of carbonate, bicine, and borate. All mobile phases contained 100 mM NaCl. Each of the nine molecular mass standards (Table 1) was run at a flow rate of 0.5 mL/min at ambient temperature. Retention volume was determined from the retention times and the flow rate of the HPLC. The standards were run 6 times during the course of the experiments using a pH 7.0 phosphate mobile phase; the retention times were essentially constant, with deviations not greater than 0.05 mL in retention volume.
Size-exclusion chromatographic analysis of Mt-ALR
The ENrich SEC 650 column was equilibrated with 30-90 mL of mobile phase prior to the running of any Mt-ALR or standard. Equilibration was assumed complete when a steady baseline was obtained. Once equilibrated, a 10 μL injection of Mt-ALR was performed by the auto-sampler. Each Mt-ALR sample was run for one hour at ambient temperature. The apparent molecular mass of Mt-ALR was determined by comparison of the elution time to the pH 7.0 calibration curve.
The precision of the molecular mass determination was estimated by calculating the overall relative standard deviation (RSD) of six sets of replicate measurements (totaling 24 individual retention measurements). The precision was approximately 1% RSD, or about 0.6 kDa.
Martin (1949) first showed that the retention factor R of a species undergoing a reaction is given by the sum of the retention factors of each form weighted by the mole fraction of that form, (Equation 1), where fi is the mole fraction of the i^th form and R_i is the retention factor of the i^th form. Therefore, if only two forms (monomer and dimer) exist, the apparent molecular mass is (Equation 2) where M_exp is the experimentally observed apparent molecular mass, M_1 is the molecular mass of the monomer, and M_2 is the molecular mass of the dimer; f_1 and f_2 are the mole fractions present as monomer and dimer, respectively. Thus, the value of the apparent molecular mass depends on the association constant for the dimerization as well as the kinetics of the reaction (Yu et al., 2006). A monomer in rapid equilibrium with its dimer will elute from a SEC column with an apparent molecular mass that is between the molecular masses of the monomer and the dimer.
Consider a monomer (A) in equilibrium with its dimer (A2), (Equation 3). The equilibrium constant K_dimer is: (Equation 4) where [A] is the molar concentration of the monomer and [A2] is the molar concentration of the dimer. We also know that: (Equation 5). Then equations 3, 4, and 5 can be combined to give: (Equation 6)where [M_o] is the total, formal concentration of the enzyme.
From equations 2 and 6, we get: (Equation 7) in which only the experimentally obtained M_exp and the total, formal concentration of the enzyme [M_o] are needed to evaluate the association constant K_dimer.
The concentration of a solute changes as it elutes through a chromatographic column. Assuming Gaussian behavior, the ratio of the solute’s concentration on the column, c, to the concentration of the injected solute, C_inj, is given by: (Equation 8) where V_inj and V_R are the injection and retention volumes, respectively, and N is the column efficiency (Snyder and Kirkland, 1979). Since V_R increases linearly as the solute moves down the column, but N increases as a square root, the first 10% of the column is responsible for the majority of the dilution. For Mt-ALR, the concentration varied from 19.4 to 0.3 μM within the first 10% of migration, but only from 0.33 to 0.11 μM during the remaining 90%, with the calculated average being 0.16 μM. Substituting this value for [Mo] in equation 7, shown above, allows the determination of K_dimer.
RESULTS
Retention volumes of standards

Figure 1. Relationship between the molecular mass of protein standards and the retention volume, used as the calibration curve for determining the apparent molecular mass of M. tuberculosis alanine racemase. The retention volumes remained essentially constant over the pH values of 6.0, 7.0, and 8.0. The line of best fit was constructed using all three pH values. The apparent larger deviation at lower molecular mass is due to the logarithmic relationship, not greater errors in that range. Measurements performed on a Bio-Rad ENrich SEC 650 column at ambient temperature and a flow rate of 0.50 mL/min. The protein standard (2000 kDa) was tested at only pH 8 for stability reasons.
The column manufacturer states that the column is stable over the pH range 2-12 (BioRad, n.d.) The retention volumes of the nine molecular mass standards at pH 6.0, 7.0 and 8.0 are presented in Figure 1, and were used as the size-exclusion chromatography (SEC) calibration curve. The apparent larger deviation at lower molecular mass is due to the logarithmic relationship, not greater errors in that range. Consistent with the manufacturer’s specifications, the retention volumes were essentially invariant over the pH 6.0-8.0 range tested. Reliable size standards over the entire pH 6.0-11.0 range were not available to us so it is conceivable that the retention characteristics of the column changed at pH levels above 8.0, but unlikely as the column is specified to be stable up to pH 12.0.
Apparent molecular mass and extent of dimerization of Mt-ALR
The apparent molecular mass of Mt-ALR at various pH and buffer systems was determined from the SEC calibration curve. These values are shown in . The anticipated molecular mass of ALR dimer is about 82 kDa. Thus, Mt-ALR was neither completely dimer nor completely monomer in any of the tested systems.
The apparent molecular masses in Table 2 show no direct dependence on pH and appear quite scattered considering the precision obtained between completely independent trials. The scatter is particularly evident at pH 8.0, where six different buffer systems were used, and the apparent molecular masses ranged from 62.0 to 76.6 kDa.
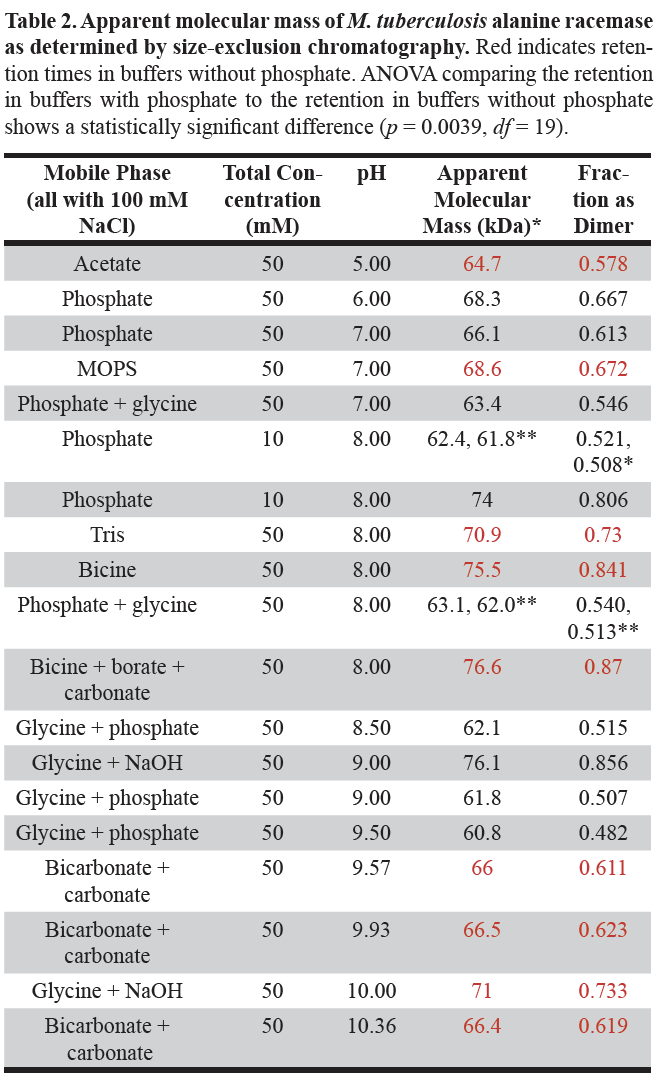
*Each apparent molecular mass was obtained by averaging the values obtained for retention volume measurements
**These represent independent experiments and give an estimate of the experimental error.
If, however, one considers only those buffers without phosphate, indicated in Table 2 in red, the apparent molecular masses at pH 8.0 range from 70.9 to 76.6 kDa for the 3 buffer systems. Restricting attention to the buffers without phosphate, over the pH range 5.0 to 10.4, the apparent molecular mass starts at approximately 64.7 kDa, increases to a maximum of 76.6 kDa at pH 8.0 and then decreases to approximately 66.4 kDa at pH 10.4. Generally, lower apparent molecular masses were observed in the presence of phosphate in buffers and higher apparent molecular masses were observed in the absence of phosphate.
Also shown in Table 2 are the calculated fraction of the Mt-ALR present as the dimer as shown in equation 7 above. An ANOVA of the values in the buffers without phosphate to those in the buffers with phosphate shows that the difference is statistically significant (p = 0.0039, df = 19). Thus, the presence of phosphate in the buffer reduced the extent of dimerization.
When the phosphate concentration is reduced from 50 mM to 10 mM at pH 8.0, the apparent molecular mass of Mt-ALR increased from approximately 62 kDa to 74 kDa, essentially the same as that in the buffers without phosphate (Table 2).
Determination of the association equilibrium constant

Figure 2. The equilibrium constant for dimerization (K_dimer) of M. tuberculosis alanine racemase as a function of pH and buffer conditions, determined using size exclusion chromatography. All buffers had 50 mM total buffering agent and 100 mM NaCl. K_dimer was calculated from the apparent molecular mass as described in the text. Buffers without phosphate showed greater dimerization than ones with phosphate.
The K_dimer value was calculated following the procedure described above. Figure 2 shows the values obtained. For buffers containing phosphate, the smallest value was 1.7 x 10^7 M^-1, found in pH 9.5, 25 mM phosphate and 25 mM glycine. The largest value was 2.4 x 10^8 M^-1, found in pH 8.0, 10 mM phosphate. For buffers without phosphate, the smallest value was 3.2 x 10^7 M^-1 found in pH 5.0, 50 mM acetate, while the largest value was 6.0 x 10^8 M^-1, found in pH 8.0, 16.7 mM bicine, 16.7 mM borate, and 16.7 mM carbonate.
DISCUSSION
This study investigated the solution behavior of Mt-ALR. Size-exclusion chromatography (SEC) revealed apparent molecular mass consistent with a monomer-dimer equilibrium over the pH range from 6.0 to 10.4. Furthermore, the position of the equilibrium was sensitive to the solution composition.
For Mt-ALR, K_dimer varied from 1.7 x 10⁷ to 6.0 x 10^8 M^-1. In their examination of seven ALRs from Gram-negative bacteria, Ju et al. (2011) found values of 1.3 x 10^5 M^-1 to 1.6 x 10^6 M^-1, that is, two orders of magnitude lower. Their determinations were performed by sedimentation equilibrium measurements, with concentrations of approximately 5 to 10 μM, while the measurements here were performed approximately two orders of magnitude lower concentration. We note that their measurements were all at pH 7.0, with EDTA and PLP in solution, and the range represents ALRs from different species.
We studied Mt-ALR in a variety of buffer systems covering a wide range of pH. Many previous studies have used a phosphate buffer system to test of their ALR species (Ju et al., 2011; Yokoigawa et al., 2003). Our study found that phosphate has an interfering effect on ALR dimerization. We observed lower apparent molecular masses and lower equilibrium association constants in buffer systems containing 50 mM phosphate. These results support the idea that phosphate inhibited the dimerization of ALR. This finding is important when designing inhibitors for Mt-ALR and ALRs from other species, as a different buffer system could change a formally low-equilibrium association constant ALR species to high-equilibrium association constant species by the removal of phosphate in testing. When ALR inhibitors are tested, it should be remembered that phosphate also inhibits the dimerization of Mt-ALR.
ACKNOWLEDGMENTS
This material is based upon work supported by the National Science Foundation under Grant No. CHE-0959229. We are also grateful to PA State System of Higher Education for the FPDC grant.
REFERENCES
Anthony KG, Strych U, Yeung KR, Shoen CS, Perez O, Krause KL, Cynamon, MH, Aristoff PA, Koski RA. (2011). New Classes of Alanine Racemase Inhibitors Identified by High-Throughput Screening Show Antimicrobial Activity against Mycobacterium tuberculosis. PLoS ONE, 6(5), 9.
Asojo OA, Nelson SK, Mootien S, Lee Y, Rezende WC, Hyman DA, Matsumoto MM, Reiling S, Kelleher A, Ledizet M, Koski RA, Anthony KG. (2014). Structural and biochemical analyses of alanine racemase from the multidrug-resistant Clostridium difficile strain 630. Acta Crystallographica Section D, 70(7), 1922-1933. doi: doi:10.1107/S1399004714009419
Azam MA and Jayaram U. (2016). Inhibitors of alanine racemase enzyme: a review. Journal of Enzyme Inhibition and Medicinal Chemistry, 31(4), 517-526. doi: 10.3109/14756366.2015.1050010
BioRad Laboratories. (n.d.) ENrich SEC 70 ENrich SEC 650 High-Resolution Size Exclusion Columns: Instruction Manual. Hercules,CA:Author.
Cook R, Barnhart R, Majumdar S. (2018). Effect of pH on the kinetics of alanine racemase from Mycobacterium tuberculosis. Journal of Young Investigators, 3(1), 4.
Ju J, Xu S, Furukawa Y, Zhang Y, Misono H, Minamino T, Namba K, Zhao B, Ohnishi K. (2011). Correlation between catalytic activity and monomer–dimer equilibrium of bacterial alanine racemases. The Journal of Biochemistry, 149(1), 83-89. doi: 10.1093/jb/mvq120
Ju J, Yokoigawa K, Misono H, Ohnishi K. (2005). Cloning of alanine racemase genes from Pseudomonas fluorescens strains and oligomerization states of gene products expressed in Escherichia coli. Journal of Bioscience and Bioengineering, 100(4), 409-417. doi: 10.1263/jbb.100.409
LeMagueres P, Im H, Ebalunode J, Strych U, Benedik MJ, Briggs JM, Kohn H, Krause KL. (2005). The 1.9 Å Crystal Structure of Alanine Racemase from Mycobacterium tuberculosis Contains a Conserved Entryway into the Active Site. Biochemistry, 44(5), 1471-1481. doi: 10.1021/bi0486583
Martin APJ. (1949). Some Theoretical Aspects of Partition Chromatography. Biochemical Society symposium, 3, 17.
Scaletti ER, Luckner SR, Krause KL. (2012). Structural features and kinetic characterization of alanine racemase from Staphylococcus aureus (Mu50). Acta Crystallographica Section D, 68(1), 82-92. doi: 10.1107/S0907444911050682
Shimadzu. LCsolutions (Version 1.25). Shimadzu Scientific Instruments, Colombia, MD: Shimadzu Scientific Instruments. Retrieved from https://www.ssi.shimadzu.com/products/informatics/class-agent-ver-2/specification.html
Silverman RB. (1988). The Potential Use of Mechanism-Based Enzyme Inactivators in Medicine. Journal of Enzyme Inhibition, 2(2), 73-90. doi: 10.3109/14756368809040714
Snyder LR and Kirkland JJ. (1979). Introduction to Modern Liquid Chromatography (I. John Wiley & Sons Ed. Second ed.).
Walsh C. (2003). Antibiotics: actions, origins, resistance. Washington: American Society for Microbiology (ASM).
World health report (1996). [Press release]. Retrieved from https://www.who.int/whr/1996/media_centre/press_release/en/
Xue Z, Hu Y, Xu S, Ohnishi K, Ma Y, Ju J, Zhao B. (2013). Characterization and preliminary mutation analysis of a thermostable alanine racemase from Thermoanaerobacter tengcongensis MB4. Extremophiles, 17(4), 611-621. doi: 10.1007/s00792-013-0545-5
Yokoigawa K, Okubo Y, Soda K. (2003). Subunit interaction of monomeric alanine racemases from four Shigella species in catalytic reaction. FEMS Microbiology Letters, 221(2), 263-267. doi: 10.1016/S0378-1097(03)00216-7
Yu C-M, Mun S, Wang N-HL. (2006). Theoretical analysis of the effects of reversible dimerization in size exclusion chromatography. Journal of Chromatography A, 1132(1), 99-108. doi: https://doi.org/10.1016/j.chroma.2006.07.017