
Author: Julie A. Steinke
Institution: University of Alberta
ABSTRACT
Deforestation impacts tropical forests and alters habitats worldwide, which can negatively affect sensitive species. Reforestation efforts are currently increasing. However, little is known about herpetofaunal (reptile and amphibian) reconstruction post-reforestation, other than that it is a slow process. This study focuses on determining impacts of reforestation efforts in coastal Ecuador. Transects at similar elevations were established in a forested and reforested area in and near the Jama-Coaque Ecological Reserve. Visual Encounter Surveys (VES) were carried out, and species richness, abundance, composition, and density were determined. A Chi-square test was used to determine association between reptiles and amphibians within the two sites, and a t-test was used to determine if there was a significant difference in species density between the two sites. Five species of reptiles and eight species of amphibians were detected. Transects within the reforested area yielded six species (n = 27) and transects within the forested area yielded ten species (n = 132). Species richness and abundance were higher in the forested area, and a significant association was found between reptiles and amphibians within the two sites. Density was not significantly different between the two sites, and the species composition in both sites was representative of typical ecological community structures with little overlap between sites. These results provide baseline data to facilitate a better understanding of reforestation effects, which will contribute to the development of better management practices in remaining tropical forests and thus better protection of Earth’s biodiversity.
INTRODUCTION
Biodiversity is the foundation of life on Earth, and all organisms play roles in ecosystem processes as part of the food web or otherwise. Reptiles and amphibians are not only important to food webs, but they commonly link aquatic and terrestrial systems (Urbina-Cardona, 2008). Over half of all species on Earth, including almost 50% of amphibians and around 32% of reptiles, live in tropical forests, which comprise 7% of Earth’s terrestrial ecosystems (Urbina-Cardona, 2008). Many herpetofaunal (reptile and amphibian) species are in decline and at risk of extinction due to changes in how the land is used, which affect the environment. Amphibians are therefore important as key indicators of environmental health, since negatives changes to the environment such as habitat loss, introduced species, pollution and contaminants, pathogens, climate change, and interactions between these factors (McCallum, 2007) often have negative impacts on amphibian survival through reduced reproduction rates, loss of genetic diversity, population isolation, and changes in growth and activity levels (Urbina-Cardona, 2008). Rates of extinction are increasing exponentially, and current amphibian extinction rates are roughly 211 times greater than background rates, with an expected increase to 25,000-45,000 times greater than background rates within the next 50 years (McCallum, 2007). It is crucial that a sufficient amount of habitat is protected to ensure that not only are amphibians protected, but that all herpetofaunal species are protected, as they all play critical roles within their ecosystems and are important to maintain biodiversity as well as health and stability within their respective environments. The loss in biodiversity that would result from further decreases in reptile and amphibian populations would negatively impact critical ecosystem functions (McCallum, 2007), which would in turn affect the overall environment. This would negatively impact current human quality of life, as biodiversity supports growth of natural resources that humans rely on for food, shelter, medicine, and materials needed to produce commodities (Urbina-Cardona, 2008).
Herpetofaunal extinctions and extirpations (localized extinctions) occur for many reasons, including changes in land usage such as deforestation, landscape fragmentation, and landscape degradation, all of which result in decreases in available herpetofaunal habitat (Urbina-Cardona, 2008). Other reasons for the increase in extinction and extirpation rates include diseases and pathogens, pollution and toxin bioaccumulation, overexploitation, which includes pet trade trafficking and scientific collection, the introduction of invasive species, climate change, or combinations of these factors (McCallum, 2007; Urbina-Cardona, 2008). A loss of suitable habitat used for breeding sites, such as seasonal ponds that certain species rely on for breeding, affect the timing of duration of breeding periods for these individuals, which can increase the frequency of extinction and extirpation events. Habitat loss reduces the geographic ranges of individuals. In addition, it has a secondary effect of creating isolated populations, which decreases genetic diversity, as separate populations may be unable to cross between fragmented areas and through anthropogenic barriers in order to maintain genetic diversity through interbreeding. A combination of the previously mentioned factors, especially habitat loss and climate change, can also result in changes in the growth rates of individuals, as well as changes in activity patterns and microhabitat use (Urbina-Cardona, 2008).
Although deforestation is a worldwide issue, it is especially prominent in tropical countries such as Ecuador. Deforestation may have negative effects on reptile and amphibian species richness, reproductive success, community composition, and biomass (Enge & Marion, 1986). Availability of food as well as water for breeding may be altered due to deforestation (Enge & Marion, 1986). Edge effects resulting from deforestation may impact wind speed, moisture levels, temperature regimes, solar penetration, and vapour pressure near forest edges, which may adversely impact herpetofauna (Lehtinen, Ramanamanjato, & Raveloarison, 2003). Deforestation may also increase the amplitude of seasonal environmental fluctuations (Heinen, 1992), negatively effecting ectothermic herpetofauna, especially moisture-dependent amphibians (Lehtinen et al., 2003). As the negative effects of deforestation become more visible, reforestation efforts are on the rise, and it is important to understand how herpetofauna are affected by reforestation efforts. No published studies to date have followed the long term changes in herpetofauna that occur post-reforestation until forest maturation is reached, but a previous small-scale study indicated that herpetofaunal restoration is a slow process (Heinen, 1992). Additionally, this same small-scale study demonstrated that maintenance of primary forest (a naturally-occurring and relatively undisturbed forested area) is critical for the survival of some species (Heinen, 1992). Studies have been conducted to compare naturally forested areas to disturbed areas (Enge & Marion, 1986; Heinen 1992), but reforested areas should be of special concern because non-native species are often introduced for economic rather than ecological purposes. Trees are planted during reforestation efforts are typically planted in an organized fashion rather than in a way that mimics natural dispersion, causing further differences between reforested areas and their natural counterparts. More research is needed to fully understand the long-term impacts on herpetofaunal restoration after reforestation.
This study was conducted to determine whether there are differences in species richness, abundance, composition, and density between a forested area (primary forest) and a reforested area (reforested one year prior to the commencement of the study) at similar elevations within and near the Jama-Coaque Ecological Reserve, which is located in the Pacific coastal forests near Camarones, Manabi Province, Ecuador. We hypothesized that species richness, abundance, composition, and density would be lower in the reforested area compared to the forested area.
Because moisture and elevation influence the density, diversity, and biomass of herpetofaunal communities (Heinen, 1992), the chosen study areas were situated at similar elevations (249-435m above sea level) in close proximity. Studies at both forested and reforested sites were conducted in September 2013 during the dry season. At each site, one transect was established following a creek and two were established through terrestrial vegetation in order to obtain accurate representation from both terrestrial and aquatic habitats.
MATERIALS & METHODS
Study Area and Site Selection
The research was carried out in and near the Jama-Coaque Ecological Reserve, Camarones, Manabi province, Ecuador. The Reserve is located on one of the largest remaining tracts of undisturbed coastal equatorial primary forest, within the Tumbes-Chocó-Magdalena conservation corridor (J. Trujillo, personal communication, August 19, 2013). This biodiversity hotspot was partially deforested during road construction and the spread of agricultural lands between 1965 and 1975 (J. Trujillo, personal communication, August 19, 2013). With current reforestation efforts in these areas, it is an ideal location for gathering baseline data relevant to the herpetofaunal responses to reforestation.
The area in which this study was conducted contains both tropical wet forest and cloud forest. The average daily temperature and monthly rainfall of the area range from 19-28 °C with less than ten centimeters per month in the dry season and 24-31 °C with 2-100cm/month in the wet season (J. Trujillo, personal communication, August 19, 2013). The sites selected for this study included an area of primary forest on the reserve (Montanita trail; elevation of 252-435m above sea level) and a reforested area adjacent to the reserve (Site A in the Finca de Mandera, which is managed by Third Millennium Alliance through the Jama-Coaque Ecological Reserve; elevation of 249-283m above sea level). The primary forest vegetation consists of trees, small shrubs, and herbs. Vegetation in the reforested area consists of grasses and tree saplings of various native species. Three transects were established in each of the two sites.
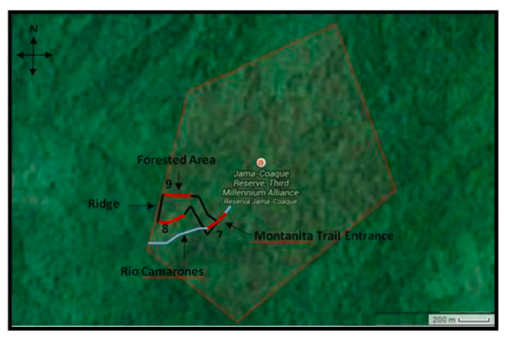
Figure 1. Three 200 m transects through the Primary forest of Montanita trail in the Jama-Coaque Ecological Reserve. One through the river (#7), one on the southern portion of the trail, (#8) and one on the northern portion of the trail (#9). All transects are illustrated in red, while theriver is illustrated in blue, and the pre-existing Montanita trail in black.

Figure 2. Three parallel 200 m transects through the reforested area near the Jama-Coaque Ecological Reserve. One through the creek (#2), one north of the creek (#3), and one south of the creek (#1).All transects are approximately equidistant from each other and are illustrated in red, while the creek is illustrated in blue, and the plot border in black.
Establishment of Transects
The Global Positioning System (GPS) coordinates for sites were recorded using the Universal Transverse Mercator (UTM) coordinate system. One transect in the primary forest was established along the creek (Rio Camarones) at the entrance to the trail (start point: 17M 0597220mE 9987147mN; end point: 17M 0597078mE 9987013mN), one transect originated at the end of the ridge at the western edge of the trail and descended along the southern slope (start point: 17M 0596908mE 9987141mN; end point: 17M 0596740mE 9987098mN), and the third transect originated from the other end of the same ridge along the northern slope (start point: 17M 0596912mE 9987348mN; end point: 17M 0596758mE 9987394mN; Figure 1). All transects were 200m in length. The creek transect, established by two people equipped with a 30m measuring tape, extended 100m in each direction from the trail entrance. Both ends of the transect were labelled and marked with flagging tape, and GPS coordinates and elevation were measured with a GPS device and recorded. The other transects extended 200m eastward along the trail from each end of the western ridge, and both were established and documented in similar fashion to the creek transect. The creek and the trail were followed in order to minimize impact on the environment, but a machete was used for additional clearing where passage was difficult.
Transects in the reforested area were similarly established, but each transect was measured by one person using a 100m rope. One transect in the reforested area was established along a creek through the middle of the site (start point: 17M 0596889mE 9987847mN; end point: 17M 0596710mE 9987885mN). The second tract was located midway up the hills to the south (start point: 17M 0596901mE 9987741mN; end point: 17M 0596724mE 9987837mN). The third tract was positioned north of the creek (start point: 17M 0596701mE 9987919mN; end point: 17M 0596879mE 9987925mN; Figure 2). The transects on either side of the creek were roughly parallel to the creek and located along linear clearings in the grass where trees were planted one year prior to the study. All transects were 200m in length and extended east to west with a 50m buffer from the western edge of the site to exclude species from adjacent areas. The ends of each transect were labelled and marked with flagging tape, and GPS coordinates and elevation were measured with a GPS device and recorded.
Survey Methods
Visual encounter surveys (VES) were conducted three times for each transect over a three-week period during September 2013. Each VES began between 1400 and 1500 h or 2000 and 2100 h and required one to two hours to complete. To conduct VES, each transect was surveyed twice in the afternoon to identify diurnal individuals during the hottest portion of the day and once in the evening to identify nocturnal individuals. Researchers minimized disturbances in the transect area by walking as quietly as possible before, during, and after each survey. At the beginning of each VES, the date and start time were recorded, and current weather conditions were visually noted and recorded. Researchers then walked along each transect in a westward direction (except for the northern transect in the reforested area, which was traversed in an eastern direction due to difficulties accessing the transect from the east) while looking and listening for herpetofaunal individuals within two meters of each side of the transect where vegetation allowed. The substrate, grasses, shrubs, trees, other plants, and crevices were all thoroughly searched with the use of a hand-held flashlight. Areas under natural cover objects such as rocks, logs, and leaf litter were also inspected. Every attempt was made to return these objects to their original location to minimize disturbances. When an animal was located, a photograph was taken, GPS coordinates were recorded when the equipment was available to do so, and photo numbers, predominant vegetation, microhabitat, height off the ground, species, estimated size, and distance from water for creek transects were recorded. Snout-vent length was estimated for anurans while total length was estimated for lizards and snakes. The end time was recorded upon completion of the survey. The transects were left undisturbed for a minimum of 12 hours before returning to begin the following VES, and the transects were surveyed in the same order each time: one, two, three, seven, eight, nine.
Species Identification Methods
Whenever possible, species were identified in the field. Otherwise photos were used in conjunction with reference materials, including Ron, Guayasamin, Yanez-Muñoz, Merino-Viteri, & Ortiz (2013), Savage (2002), Torres-Carvajal, Salazar-Valenzuela, & Merino-Viteri (2013) and Valencia (2008). When these resources were not sufficient to identify the species of an individual, a local herpetologist, Ryan Lynch of The Biodiversity Group, was consulted.
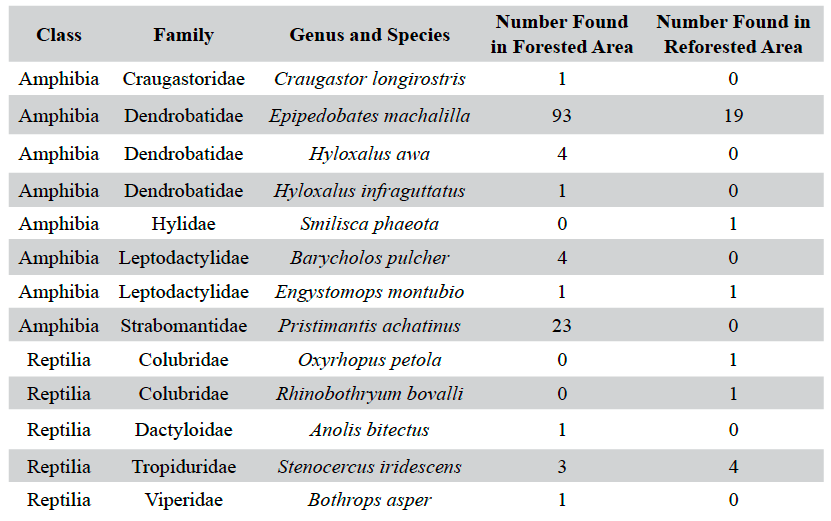
Table 1. The species composition of reptiles and amphibians detected during Visual Encounter surveys for a forested and reforested area in and near the Jama-Coaque Ecological Reserve.
Analysis
Species richness was calculated for each transect in order to take microhabitat into consideration and for each site in order to compare the two study areas overall. This was accomplished by calculating and comparing the number of species and individuals within species detected in each area. Counts of individuals were used to estimate abundance of each species for each site for general comparisons, and a Chi-square test was carried out to determine whether the numbers of amphibians and reptiles detected in the two study areas were comparable. A two by two contingency table with one degree of freedom was created, and the Yates’ correction was applied. Species composition was determined in order to look at species evenness, community structure, and species overlap between sites. Species density, defined as individuals per meter, was estimated for each transect, and a Student’s t-test was employed to determine whether there was a significant difference between species densities between forested and reforested sites.
It was assumed that data from the transects were representative of the site, all individuals had an equal chance of being observed, all samples were random, all observations were independent, all abiotic factors were equal and did not affect data collection, and observer bias was consistent throughout the study.
RESULTS
Overall, five species of reptiles (n = 11) and eight species of amphibians (n = 148) were observed (Table 1). Of these, the forested site had higher species richness, hosting three species of reptiles (five individuals) and seven species of amphibians (127 individuals). The reforested site hosted three species of reptiles (six individuals) and three species of amphibians (21 individuals). The transects running through creeks had higher numbers of individuals in both sites; 109 of the 132 individuals in the forested site and 21 of the 27 individuals in the reforested site were found in the creek transects. Although the forested site had a higher abundance overall, there was a statistically significant difference between the number of reptiles compared to amphibians between the two sites, χ2 (df =1, n =159) = 9.14, p < .05. Upon closer inspection of the contingency table, the calculated value for reptiles in the reforested area is much greater than the other calculated values, indicating an association between these factors. As the observed frequency of reptiles in the reforested area is greater than the expected frequency, we can infer a positive relationship between reptiles and reforested areas.
Epipedobates machalilla was the most abundant herptile species at both sites, accounting for roughly 70% of the total individuals observed and for the major numerical difference in abundance between the two sites (Figures 3 and 4). Of the two most abundant species in the forested area (Figure 3), E. machalilla was commonly seen near the river, while Pristimantis achatinus was commonly found in more wooded habitats, including along the river. Of the two most abundant species in the reforested area (Figure 4), E. machalilla was commonly observed near the creek, whereas Stenocercus iridescens was found along the edge of vegetation. Species composition overlapped between the sites (3/13, 23% of species, 121/159, 76.1% of individuals), but most species were found at only one site.
The mean herptile density was estimated for each of the two sites, and a t-test was used to determine if there was a significant difference. Although species density was higher in the forested site (M = 0.073 individuals/m, SD = 0.109) compared to the reforested site (M = 0.015 individuals/m, SD = 0.017), the difference was not statistically different as determined by a Student’s t-test (p > .05).
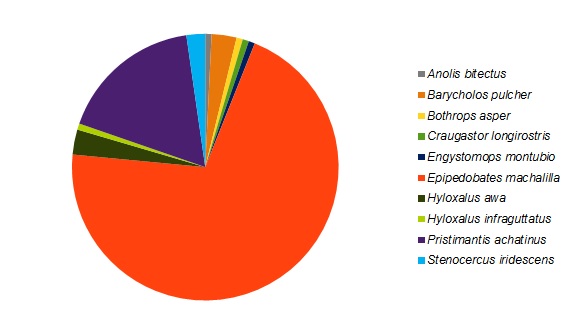
Figure 3. The species composition for the reptiles and amphibians detected in a section of primary forest in the Jama-Coaque Ecological Reserve in coastal Ecuador.

Figure 4. The species composition for the reptiles and amphibians detected in a reforested area near the Jama-Coaque Ecological Reserve in coastal Ecuador.
DISCUSSION
We hypothesized that species richness, abundance, composition, and density would differ between the forested and reforested sites and that these measures would be lower in the reforested area compared to forested. Species richness and abundance were higher in the forested site, and the presence of water increased richness on transects within both sites. Differences in the abundance of reptiles and amphibians was found to be statistically significant between the two sites; more reptiles were observed in the reforested site. Although E. machalilla represented 70% of all species observed and there was some overlap of species, most species were found in only one site. However, there was no statistically significant difference between the mean species densities of the two sites.
Low numbers for both species richness and abundance of amphibians in the reforested site compared to the forested site could be due to the well-documented sensitivity of amphibians to human disturbance. Low amphibian numbers in the reforested area may be a result of lingering impacts of habitat alteration, changes in food and habitat availability, changes in water quality that negatively impact breeding success, or direct mortality during both deforestation and reforestation efforts, which was observed during clear-cutting operations in Florida (Enge & Marion, 1986). Reduction of tree cover may also contribute to lower numbers of amphibians in the reforested area by increasing climatic extremes such as temperature and moisture (Heinen, 1992). Lehtinen et al. (2003) found that frogs in Madagascar avoided open areas during the dry season, possibly due to the permeable nature of amphibian skin, which could account for these results.
It is possible that a significant positive association between reptiles and reforested area was observed because reptiles are less sensitive than amphibians. Thus, these results suggest reptiles may be the first step in herpetofaunal reconstruction, which would explain the higher prevalence of reptiles in this disturbed area compared to amphibians.
In this study, abundance was lower in the reforested site, which contrasts with Heinen’s (1992) findings in Costa Rica, where both abundance and biomass increased in disturbed sites. Lower abundance in the reforested site may have been due to the dry season and the decreased ability of the reforested area to retain moisture in the air, resulting in reduced amphibian activity levels. This could also account for the positive association detected between reptiles and the reforested area. Reptiles do not have permeable skin and are therefore not as sensitive to dry conditions as amphibians.
Although many reptilian individuals were observed on the outer edges of the reforested area, these were not detected during the surveys, which took place in the interior. Tall grass may have reduced visibility adjacent to the transect on the ground and produced errors in sampling if not all individuals present were detected. The survey was completed during the end of the dry season, which most likely resulted in low amphibian activity compared to warmer, wetter seasons. Scott (1976) found that approximately four amphibian species disappear for each additional month of the dry season in tropical forests.
According to Verberk (2011), more than half of all individuals in any given area typically belong to one species. The species composition observed in this study supports this idea, as approximately 70% of individuals detected in each site were E. machalilla. This also indicates that the sites surveyed likely follow a typical community structure, and further surveys could be employed to detect a few rare and many moderately abundant species. However, small sample sizes could be a source of error for this assumption, as larger sample sizes may have showed a different distribution. Additionally many E. machalilla were transformlings (immature frogs at a life stage between tadpoles and fully formed adults), which could be a source of error if this was the only species reproducing at this time, resulting in a higher proportion of them than normal relative to other species in the area.
In general, herpetofaunal densities are greater in wet areas than in dry areas, and flat terrains harbour more individuals than slopes (Heinen, 1992; Scott, 1976). There was no significant difference between the mean densities in each site. All transects except those located in water were on slopes, and the highest concentration of herpetofauna in each site was observed in the flat wet transects. Roughly 70% of the individuals at both sites were E. machalilla, a species that favours these same habitat types.
It is possible that a higher number of species in the primary forest resulted from the proximity of this wet forest to nearby cloud forest, as the perpetually moist conditions in cloud forests have been shown to reduce habitat seasonality of amphibian species (Scott, 1976).
Both sites may have been disturbed by heavy clearing activity nearby, which occurred shortly after the establishment of the transects and before sampling commenced. Limitations also include an inability to identify some animals that were not photographed and small sample sizes. Higher sample numbers could be achieved by prolonged sampling, specifically into the wet season and shortly thereafter. The use of VES in conjunction with other methods such as pitfall traps and quadrat leaf litter searches may have also have yielded more data because pitfall traps typically find cryptic species more effectively, and use of a combination of methods increases study effectiveness, improves sample representation, and reduces the number of surveys needed, thus decreasing human impact (Ribeiro-Júnior, Gardner, & Ávila-Pires, 2008). Pitfall traps also reduce observer bias (Enge & Marion, 1986).
Although these results indicate no significant difference between the mean density of the two sites, the lower species richness and abundance in the reforested area, a positive association between reptiles and the reforested area, and only 23% overlap in species composition between the two areas indicates that further studies monitoring yearly changes would be of value. Restoration of herpetofauna is a lengthy process with no known time frame, and as areas continue to be reforested, maintenance of primary forest will continue to be vital. This will ensure that reforestation of areas will not negatively impact the long term success of species present prior to deforestation. By learning more about the effects of reforestation on herpetofauna through further research, the impacts human actions have on these species can be better understood so that more effective ways of protecting and conserving them in areas of high human disturbance can be developed. This will increase the chance of survival of rare species and key indicator species that play important roles in ecosystems and life functions. Further research will contribute to the protection of the biodiversity of the Jama-Coaque Ecological Reserve and other areas impacted by reforestation efforts and changes in land usage.
ACKNOWLEDGEMENTS
I thank John Acorn for his support and help with editing, my family for all their support while carrying out this research, and Maddy Ballard, Bianca Fierro, and Uver Vaka for their help during the research process. Thank you to Ryan Lynch for assistance with species identification, Third Millenium Alliance for providing accommodations and access to the reserve, Jordan Trujillo for guidance with both the research and writing of the initial report, and the support of many others throughout the survey and writing process.
REFERENCES
Enge, K. M., & Marion, W. R. (1986). Effects of clearcutting and site preparation on herpetofauna of a north Florida flatwoods. Forest Ecology and Management, 14, 177-192.
Heinen, J. T. (1992). Comparisons of the leaf litter herpetofauna in abandoned Cacao plantations and primary forest in Costa Rica: Some implications for faunal restoration. Biotropica, 24(3), 431-439.
Lehtinen, R. M., Ramanamanjato, J-B., & Raveloarison, J. G. (2003). Edge effects and extinction proneness in a herpetofauna from Madagascar. Biodiversity and Conservation, 12, 1357-1370.
McCallum, M. L. (2007). Amphibian decline or extinction? Current declines dwarf background extinction rate. Journal of Herpetology, 41(3), 483-491.
Ribeiro-Júnior, M. A., Gardner, T. A., & Ávila-Pires, T. C. S. (2008). Evaluating the effectiveness of herpetofaunal sampling techniques across a gradient of habitat change in a tropical forest landscape. Journal of Herpetology, 42(4), 733-749.
Ron, S. R., Guayasamin, J. M., Yanez-Muñoz, M. H., Merino-Viteri, A., & Ortiz, D. A. (2013). AmphibiaWebEcuador.
Savage, J. (2002). The amphibians and reptiles of Costa Rica: A herpetofauna between two continents, between two seas. Chicago, Illinois: University of Chicago Press.
Scott, N.J. Jr. (1976). The abundance and diversity of the herpetofaunas of tropical forest litter. Biotropica, 8(1), 41-58.
Torres-Carvajal, O., Salazar-Valenzuela, D., & Merino-Viteri, A. (2013). ReptiliaWebEcuador.
Urbina-Cardona, J. N. (2008). Conservation of neotropical herpetofauna: research trends and challenges. Tropical Conservation Science, 1(4), 359-375.
Valencia, J. H. (2008). Guia de campo de reptiles del Ecuador. Quito, Ecuador: Fundacion Herpetologica Gustavo Orces.
Verberk, W. C. E. P. (2011). Explaining general patterns in species abundance and distributions. Nature Education Knowledge, 3(10), 38.