
Author: Hope E. Shaffer
Institution: Calvin College
Date: November 2008
Abstract
Sjogren's syndrome, an autoimmune disease affecting the salivary and lacrimal glands, causes gland degeneration through inflammatory lesions made of lymphocytes. This causes symptoms of dry eyes and mouth. MRL/lpr mice have been used as models of the lymphocytic infiltration characteristic of Sjogren's syndrome, and several immunohistochemical and genetic analyses have been performed on MRL/lpr lacrimal glands. However, these genetic analyses were performed on whole-gland samples, including the lymphocytic infiltrates. This study used laser capture micro-dissection (LCM) to obtain single-cell samples of both duct and acinar cells in the lacrimal gland. cDNA microarrays were used to compare genetic expression of the MRL/lpr and normal lacrimal gland duct and acinar cells. Differences in gene expression were detected between acinar and duct cells, and between diseased and normal lacrimal glands. Increased expression of proteins such as the Ro/SS antigen, lactotransferrin, and reticulocalbin were found in the duct cell samples compared to the acini cell samples. Abnormal expression of proteins such as Ly6e, STAT3, nucleolin, H2-Eb1, and Eif4e were detected in MRL/lpr lacrimal gland cells. Several of these proteins are known to be associated with inflammation or autoimmunity. These findings illustrate the utility of LCM in gene expression analyses of MRL/lpr lacrimal gland cells.
Introduction
Sjogren's Syndrome is an autoimmune disease where degeneration of the salivary and lacrimal glands produces the symptoms of dry eyes and a dry mouth. Sjogren's syndrome occurs mainly in women, and is particularly prevalent in post-menopausal women. In this disease, the lacrimal glands develop inflammatory lesions made up of CD4+ and CD8+ T lymphocytes (Jabs et al. 1997). The CD4+ cells differentiate into Th2 cells that express high levels of IL-4 mRNA (Jabs et al. 2001). The MRL/lpr mouse has been commonly used as a model for the lymphocytic infiltration of the lacrimal gland that occurs in Sjogren's syndrome (Jabs et al. 1991). These mice have altered Fas expression, leading to defective lymphocyte apoptosis and abnormal deletion of T cells that have responded to antigens (Jabs et al. 2002). The lacrimal glands of MRL/lpr mice also express the chemokine monocyte chemoattractant protein (Akpek et al. 2004), and it has been reported that the lacrimal glands of these mice and other mouse models of inflammatory lacrimal gland disease express mRNA for various apoptotic factors, such as bcl-2, Bax, c-myc and p53 (Toda et al. 1998). The lacrimal lesions of MRL/lpr mice respond favorably to systemic treatment with cyclosporin A (Jabs et al. 1996) and inflammatory foci in female MRL/lpr mouse lacrimal glands are eliminated by treatment with systemically administered testosterone (Ono et al. 1995).
Understanding the inflammatory process of Sjogren's syndrome and how it affects specific cells of the lacrimal gland is important in understanding the mechanism of the disease itself. In this study we analyzed the gene expression of specific lacrimal cell types in order to better understand what cellular processes may contribute to the abnormal recruitment of lymphocytes in Sjogren's syndrome. While many studies have focused on characterizing the nature of the inflammatory cells that infiltrate the gland in Sjogren's syndrome, little attention has been paid to the lacrimal gland cells themselves in this disease model. A few studies have examined the lacrimal epithelial cells of MRL/lpr mice through immunohistochemistry, and it has been found that acinar cells express the Fas ligand and duct cells express thymus activation regulated chemokine (TARC), which is thought to mediate the attraction of lymphocytes into the lacrimal gland (Akpek et al. 2004). Previous analyses of gene and gene product expression have been done by extracting RNA and proteins from whole glands (Toda et al. 1998), making it impossible to determine which cell types are expressing these genes.
Since these studies analyzed nucleic acids extracted from all cell types in whole glands, including the inflammatory cells, we decided to use laser capture micro-dissection (LCM) to analyze the gene expression in specific lacrimal gland cells uncontaminated by the inflammatory cells. Two types of lacrimal gland cells, acinar cells and duct cells, are involved in fluid secretion. The acinar cells, which are the major cells in the lacrimal gland, secrete the electrolytes, fluid, and proteins that make up the aqueous component of tears. The duct cells, which are relatively few in number, form the walls of the ducts that conduct fluid to the ocular surface. The duct cells also appear to contribute fluid and electrolytes to the lacrimal fluid (Alexander et al. 1972, Mircheff et al. 1994, and Ubels et al. 2006).
One of the main purposes of this study was to demonstrate the usefulness of laser capture microdissection for analysis of gene expression in acinar and duct cell samples without the lymphocyte infiltrations. LCM has been described in detail by Emmert-Buck and co-workers (Emmert-Buck et al. 1996 and Best et al. 2001). Briefly, in order to capture cells, a plastic cap with a specialized transfer film is placed over a fixed and stained frozen tissue section on a slide. The slide is placed on a light microscope with a LCM attachment.mThe laser is fired through the cap at the cells of interest. This laser pulse causes the film to bond to cell so that the cell adheres to the film and is removed from the section when the cap is lifted from the tissue section. Generally, about 250-500 laser pulses are used to collect cells on each cap. Using LCM, we were able to collect pure samples of duct or acinar cells, which yielded adequate amounts RNA for cDNA microarray analysis. Cells were collected from lacrimal glands of female MRL/lpr mice with early or advanced disease, as well as from lacrimal glands of age-matched, normal female Balb-c mice.
Methods and Materials
Female MRL/MpJ-faslpr/faclpr (MRL/lpr) mice, one month old, were purchased from Jackson Labs (Bar Harbor, ME). The mice were killed by CO2 asphyxiation at one or six months of age ( n=3 mice/age group). Age-matched female Balb/C mice (Charles River, Wilmington, MA) were used as immunologically normal controls (Akpek et al. 2004).
The lacrimal glands were removed from the mice and embedded and frozen in tissue freezing medium (Triangle Biomedical Sciences, Durham, NC). Frozen sections 6 µm thick were cut on a cryostat (Leica model CM 1850, Nussloch, Germany), mounted on aminoalylsilane-coated slides (Silane-Prep slides, Sigma, St. Louis, MO), fixed with ethanol, and stained with hematoxylin and eosin under nuclease free conditions. Cells were captured on CapSure LCM macro caps using an Arcturus Pix-cell microdissection instrument (Arcturus Engineering, Mountain View, CA). The laser was set at a power of 70-90 mW, 8 msec pulse duration and 7.5 µm spot diameter.
RNA was extracted using an Arcturus PicoPure RNA Isolation Kit (Arcturus) and subjected to two rounds of amplification using a Message Amp aRNA kit (Ambion, Austin, TX). Integrity of the initial RNA was checked by GAPDH PCR after the first round. The amplified RNA (aRNA) was then reverse transcribed to cDNA in the presence of Cy3-dCTP, followed by purification with a QiaQuick purification kit (Qiagen, Valencia, CA). The reference standard was cDNA labeled with Cy5-dCTP, obtained from total RNA of thirteen-day mouse embryos that had been subjected to one round of amplification. Labeled acinar or duct cDNA were co-hybridized with labeled reference standard to mouse microarrays containing 15,000 genes. The arrays were prepared by the microarray core laboratory at the Van Andel Research Institute (Grand Rapids, MI). Arrays were scanned on an Agilent Technologies DNA Microarray Scanner (Palo Alto, CA). The image files were analyzed using Gene Pix Pro 3.0 software (Molecular Devices Corp., Union City, CA) and the complete mouse microarray clone list to create Gene Pix result files. The files were uploaded into the Xenobase-Bio Integration Suite (XB TransMed Solutions, LLC, Grand Rapids, MI), a fully integrated genomic/proteomic/medical informatics database with associated analysis and annotation tools designed at the Van Andel Institute. As described in greater detail below, comparisons of gene expression between acini and ducts cells or between diseased and normal glands were made by cluster analysis and statistical analysis for top discriminators.
Stained sections of the lacrimal gland of each rat were also examined by light microscopy and scored for the level of lymphocyte infiltration (stage 1-4) by the method of Jabs et al. (1991)
Results
LCM and RNA yield
Acinar cell samples were captured using 500-600 laser pulses per cap. The LCM technique efficiently separated acinar cells from adjacent lymphocyte infiltrates (Figure 1A), although fragments of acinar cell membrane remained on the slide. The samples of acinar cells used in this report yielded 38.05 + 8.3 µg aRNA per sample after two rounds of amplification.

Figure 1. Laser capture microdissection (LCM) of mouse lacrimal gland acini and ducts. Laser spot size 7.5 m, pulse duration 8 msec, power 80 mW. A. Before LCM acini are seen with an adjacent lymphocyte infiltrate. After LCM acinar membrane fragments remain on the slide and the infiltrate is intact. The acinar cells adhere to the LCM cap in the absence of lymphocytes. B. Three ducts with adjacent connective tissue and acini before LCM. After LCM duct membrane fragments, connective tissue and acini remain on the slide, while duct cells adhere to the LCM cap. Bar = 25 μm
Duct cells were captured using 290-525 pulses per cap. Because of the small size and low number of ducts, it was necessary to capture cells from several sections of each gland to achieve an adequate number of cells for analysis. Ducts are surrounded by a layer of connective tissue that is not efficiently removed from the section by LCM, making it possible to capture relatively pure samples of duct cells (Fig. 1B). The duct samples used in this report yielded 45.31 ± 9.75 µg aRNA after two rounds of amplification.
Comparison of duct and acinar cells
It was assumed that the similarities between lacrimal glands of diseased and normal mice would be greater than differences, so the microarrays from the ducts or acini cells of all animals were pooled in an analysis designed to examine differences in gene expression between duct cells and acinar cells irrespective of disease state. Cluster analysis provided evidence of genomic distinction between ducts and acini in that ducts clustered separately from acinar but for a single outlier (Figure 2). Among the genes that are top discriminators between ducts and acini (Table 1), there were three of particular relevance to lacrimal function and pathology; the tripartite motif protein, also known as the Ro/SS Antigen (Trim 21), lactotransferrin (Ltf) and reticulocalbin (Rcn1). These three genes were expressed at higher levels in duct cells than in acini cells (Figures 3 and 4, Table 1).
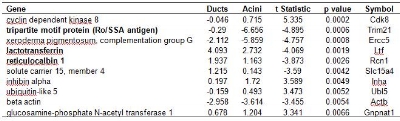
Table 1. Genes that are the top 10 discriminators between mouse lacrimal gland duct and acinar cells, irrespective of disease status, as detected on cDNA microarrays. Analysis included all duct (n=6) and acinar (n=7) microarrays from both normal and MRL/lpr mice. Values are log2 transformed sample/reference intensity ratios where a negative value indicates reduced gene expression relative to the mouse embryo reference. Negative t-statistics indicate reduced gene expression in acini as compared to ducts. Bold entries indicate genes of possible relevance to lacrimal gland function.

Figure 2. Evidence for genomic distinction between acini and ducts irrespective of disease status. Analysis included all duct and acinar microarrays from both normal control and MRL/lpr mice. Cluster analysis separates ducts from acini, except for a single outlier.

Figure 3. Increased expression of Ro/SSA antigen (Trim 21) in ducts as compared to acini irrespective of disease state. Gene expression is expressed as log2 compared to reference standard. The difference between ducts and acini is significant (p=0.0006).

Figure 4. Increased expression of lactotransferrin (Lft) in ducts as compared to acini, irrespective of disease state. Gene expression is expressed as log2 compared to reference standard. The difference between ducts and acini is significant (p=0.002).
Comparison of MRL/lpr and control lacrimal glands
To determine whether differences exist in gene expression in lacrimal glands of MRL/lpr mice and normal Balb/c mice, acinar and duct cell microarrays of the two groups were compared by cluster analysis. Glands of normal and diseased mice were correctly classified (Figure 5) , Ly6e (Figure 6) and Stat 3 (Figure 7), which are relevant to lacrimal gland inflammation, were over expressed in MRL/lpr lacrimal gland cells.

Figure 5. Evidence for differential gene expression between lacrimal glands of MRL/lpr (MRL) and normal control (Cont) mice. Cluster analysis of combined duct and acinar microarrays of normal and MRL/lpr mice correctly classified diseased and healthy glands. The data also provide evidence for differences in early and late disease genotype in MRL/lpr mice. Ducts and acini of one month old animals with stage 0 lacrimal gland disease are classified separately from ducts and acini of 6 month old animals with stage 3-4 lymphocytic infiltration. Control animals did not cluster based on age.

Figure 6. Elevated expression of lymphocyte antigen 6 complex, locus e, (Ly6e) in lacrimal gland cells of MRL/lpr mice as compared to normal mice. Gene expression is expressed as log2 compared to reference standard. The difference in levels of Ly6e expression is significant (p=5x10⁻⁶).

Figure 7. Elevated expression of signal transduction and activator of transcription 3 (Stat3) in lacrimal gland cells of MRL/lpr mice as compared to normal mice. Gene expression is expressed as log2 compared to reference standard. The difference in levels of Stat3 expression is significant (p=0.0005).
The cluster analysis also provided evidence for differences in early and late disease genotype in MRL/lpr mice. Within this group the glands of 1-month-old mice with stage 0 lacrimal inflammation were classified separately from glands of 6-month-old mice with stage 3-4 lymphocytic infiltration (Figure 5). In contrast, there were no differences in gene expression between 1 month and 6-month-old Balb/C mice.
Comparison of MRL/lpr and normal acinar cells
Not only were the epithelial cells of the lacrimal gland separated from inflammatory cells, but LCM also separates duct and acinar cells from each other so that these cell types can be compared between diseased and normal animals. Adequate numbers of duct microarrays were not available for statistically significant comparison; however, as shown by the scatterplot (Figure 8), a number of genes were expressed differentially between acinar cells of normal and MRL/lpr mice.

Figure 8. Scatterplot showing relative gene expression levels between lacrimal acinar cells of MRL/lpr and normal mice. Gene expression is expressed as log2 compared to reference standard. Several genes discriminating between diseased and normal acini are shown in Table 3.
Several genes of relevance to lacrimal function and inflammation were among the top ten discriminators between MRL/lpr and normal acinar cells (Table 3). Relevant genes included the histocompatability complex class 2 antigen Eβ (H2-EB1) (Figure 9) and the lymphocyte antigen 6 complex, locus E (Ly6e), which were over expressed in MRL/lpr acini, as well as the eukaryotic translation initiation factor 4E (Eif4e), which was under expressed in MRL acini (Table 3). All lacrimal gland gene expression data are presented as the log2 of the ratio to the reference standard.

Table 3. Genes that are the top 10 discriminators between normal (n=4) and MRL/lpr (n=3) mouse lacrimal gland acinar cells as detected on cDNA microarrays. Values are log2 transformed sample/reference intensity ratios where a negative value indicates reduced gene expression relative to the mouse embryo reference. Negative t-statistics indicate reduced gene expression in MRL/lpr mice as compared to normal mice, while positive values indicate higher gene expression in MRL/lpr animals. Bold entries indicate genes of possible relevance lacrimal gland function and inflammation.

Figure 9. Elevated expression of histocompatibility complex II antigen (H2-Eb2) in MRL/lpr lacrimal acinar cells as compared to normal acinar cells. Gene expression is expressed as log2 compared to reference standard. The difference in levels of H2-Eb2 expression is significant (p=0.0032).
Discussion
Using laser capture micro-dissection, we were able to perform a gene expression analysis of MRL/lpr and normal mouse lacrimal glands using only the specific duct and acinar cell types, without lymphocyte infiltrations. This use of laser capture micro-dissection is especially useful to the study of Sjogren's syndrome, since the analysis of duct and acinar cells collected from the MRL/lpr and normal mice yielded. For example, we found that reticulocalbin, a Ca2+ binding protein previously shown to be present in mammary gland tissue but not lymphocytes (Fukuda et al. 2006), was up regulated in the duct cells of the lacrimal gland. This demonstrates the homogeneity of our duct cell samples and confirms that laser capture micro-dissection can be used to obtain pure samples of cells without lymphocytic infiltrates. We also found that the antibacterial protein lactoferrin, one of the major tear proteins secreted by the lacrimal gland (Kijlstra et al. 1983, Fullard et al. 1990, Spitznas et al. 1996), was also strongly expressed in the duct cells as compared to the acini cells (Table 1). The source of lactoferrin in the lacrimal gland has not been previously identified. Our data demonstrate that the ducts may be the major source of this important tear protein.
We also detected several differences in protein expression between acinar and duct cells, as well as normal and diseased cells, that relate directly to Sjogren's syndrome. Of specific relevance to Sjogren's syndrom is the Ro/SS antigen, which is known to stimulate auto-antibodies in Sjogren's syndrome. We found Ro/SSA to be highly expressed in duct cells. In addition, Ro/SSA autoantibody production is known to be influenced by HLA class II genes (Paisansinsup et al. 2002). MHC class II molecules bound to self-peptides have been shown to activate pathogenic T cells in MRL/lpr mice (Suh et al. 2003), are present in the lacrimal acinar cells of Sjogren's syndrome models (Yang et al. 1999), and are generally essential for survival and proliferation of self-reactive T cells (Viret et al. 2003, Martin et al. 2003). We found that the H2-Eb1 gene, a part of the MHC class II complex, was strongly expressed in the acini of MRL/lpr lacrimal glands, and this finding agrees with the literature.
We also found a decrease in Eif4e expression in MRL/lpr cells. Inactivation of the Eif4e gene has been linked to a decrease in muscle protein synthesis due to inflammatory factors such as TNF (Lang et al. 2007). Therefore, the down regulation of Eif4e in MRL/lpr acinar cells is consistent with inflammation of the lacrimal gland. Conversely, the Ly6e complex, a cell surface protein expressed in kidney tubular epithelial cells and has been shown to be up regulated in the kidneys of mice with lupis nephrititis (Blake et al. 1993). In agreement with this observation, we also found Ly6e to be strongly expressed in both the MRL/lpr acinar and duct cells. STAT3, a protein associated with protection from UV exposure or T-cell mediated liver injury (Pan et al. 2004, Ahsan et al. 2005, Klein et al. 2005), was found to be up regulated in MRL/lpr lacrimal glands. Normally, up regulation of STAT3 results in a reduction of T cell infiltration (Burdelya et al. 2005), but it seems that up regulation of STAT3 is not enough to reduce lacrimal gland infiltration in the MRL/lpr mice.
Our findings also indicated a difference in gene expression in the lacrimal gland cells of the MRL/lpr mice as they age, since cluster analysis separated animals with stage 0 inflammation from animals with stage 3-4 inflammation.Older mice with more advanced lymphocyte infiltration have more pronounced abnormal gene expression than younger animals (Figure 5). This suggests that changes in gene expression in the lacrimal epithelial cells with aging attract increased numbers of inflammatory cells into the gland.
This study illustrates the utility of laser capture micro-dissection and cDNA microarry analysis for studying specific gene expression in the lacrimal gland cells of a mouse model of Sjogren's syndrome. Previous studies of gene expression in the lacrimal glands of MRL/lpr mice have used the whole gland, including the lymphocyte infiltrates. This study has demonstrated that the lacrimal epithelial cells themselves in the MRL/lpr mice display abnormal gene expression patterns, and these abnormalities in gene expression are consistent with susceptibility to inflammation.
Acknowledgements
Supported by Grant-in-Aid #GA04013 from Fight for Sight, New York, NY, a Calvin College Research Fellowship, and funds from the Van Andel Research Institute. The authors thank Paul Norton and Peter Haak of the Van Andel Research Institute for printing the microarrays and Dr. Craig Webb of the Van Andel Research Institute for access to the LCM and microarray equipment and assistance with the microarray data analysis.
References
Ahsan, H. et al. (2005) Ultraviolet B exposure activates Stat3 signaling via phosphorylation at tyrosine705 in skin of SKH1 hairless mouse: a target for the management of skin cancer? Biochem. Biophys. Res. Commun. 333, 241-246.
Akpek E.K. et al. (2004) Chemokines in autoimmune lacrimal gland disease in MRL/MpJ mice. Invest. Ophthalmol. Vis. Sci.45, 185-190.
Alexander J.H. et al. (1972) Water and electrolyte secretion by the exorbital lacrimal gland of the rat studied by micropuncture and catheterization techniques. Pflugers Arch 337, 299-309.
Best C.J.M. and M.R. Emmert-Buck (2001) Molecular profiling of tissue samples using laser capture microdissection. Expert Rev. Mol. Diagn.1, 53-60.
Blake, P.G. et al. (1993) Ly-6 in Kidney Is Widely Expressed on Tubular Epithelium and Vascular Endothelium and Is Up-Regulated by Interferon Gamma. J. Am. Soc. Nephrol. 4, 1140-1150.
Burdelya, L. et al. (2005) Stat3 Activity in Melanoma Cells Affects Migration of Immune Effector Cells and Nitric Oxide-Mediated Antitumor Effects. J. Immunol. 174, 3925-3931.
Emmert-Buck M.R. et al. (1996) Laser capture microdissection. Science 274, 998-1001.
Fukuda, T. et al. (2007) Distribution and Variable Expression of Secretory Pathway Protein Reticulocalbin in Normal Human Organs and Non-neoplastic Pathological Conditions. J. of Histchem. Cytochem. 55(4), 335-345.
Jabs, D.A. et al. (1991) Murine models of Sjögren's syndrome: Evolution of the lacrimal gland inflammatory lesions. Invest. Ophthalmol. Vis. Sci. 32, 371-380.
Jabs D.A. et al. (1996) Cyclosporine therapy suppresses ocular and lacrimal gland disease in MRL/Mp-lpr mice. Invest. Ophthalmol. Vis. Sci. 37, 377-383.
Jabs D.A. et al. (1997) Role of T cells in the pathogenesis of autoimmune lacrimal gland disease in MRL/Mp-lpr/lpr mice. Curr. Eye Res. 16, 909-916.
Jabs D.A. et al. (2001) Cytokines in autoimmune lacrimal gland disease in MRL/MpJ mice. Invest. Ophthalmol. Vis. Sci. 42, 2567-2571.
Jabs D.A. et al. (2002) Pathogenesis of autoimmune lacrimal gland disease in MRL/MPJ mice. Adv. Exp. Med. Biol. 506, 771-776.
Klein, C. et al. (2005) The IL-6-gp130-STAT3 pathway in hepatocytes triggers liver protection in T cell-mediated liver injury. J. Clin. Invest. 115, 860-869.
Lang, C.H. and Frost, R.A. (2007) Sepsis-induced suppression of skeletal muscle translation initiation mediated by tumor necrosis factor alpha. Metabolism 56, 49-57.
Lang, C.H. et al. (2007) Regulation of Muscle Protein Synthesis During Sepsis and Inflammation. Am. J. Physiol. Endocrinol. Metab. 293, E453-E459.
Martin, B. et al. (2003) On the role of MHC class II molecules in the survival and lymphopenia-induced proliferation of peripheral CD4+ T cells. Proc. Natl. Acad. Sci. USA 100, 6021-6026.
Mircheff A.K. et al. (1994) Control of Lacrimal Gland Function: Water and electrolyte secretion and fluid modification. In: Principles and Practice of Ophthalmology. Albert D, Jakobiec F (eds). W.B. Sanders, Philadelphia, 1994, pp. 466-472.
Ono, M. et al. (1995) Immunocytochemical location and hormonal control of androgen receptors in lacrimal tissues of the female MRL/Mp-Ipr/Ipr mouse model of Sjogren's syndrome. Exp. Eye Res. 61, 659-666.
Paisansinsup, T. et al. (2002) HLA Class II Influences the Immune Response and Antibody Diversification to Ro60/Sjogren's Syndrom-A: Heightened Antibody Responses and Epitope Spreading in Mice Expressing HLA-DR molecules. J. Immunol. 168, 5876-5884.
Pan, H. et al. (2004) Hydrodynamic Gene Deliver of Interleukin-22 Protects the Mouse Liver from Concanavalin A-, Carbon Tetrachloride-, and Fas Ligand-Induced Injury via Activation of STAT3. The Chinese Society of Immunol. 1, 43-49.
Suh, C.H., et al. (2003) T Cell Reactivity to MHC Class II-Bound Self Peptides in Systemic Lupus Erythematosus-Prone MRL/lpr Mice. J. Immunol. 170, 2229-2235.
Toda I et al. (1998) Gender- and androgen-related impact on the expression of proto-oncogenes and apoptotic factors in lacrimal and salivary glands of mouse models of Sjogren's syndrome. Adv. Exp. Med. Biol. 438, 447-452.
Ubels J.L. et al. (2006) Gene Expression in Rat Lacrimal Gland Duct Cells Collected Using Laser Capture Microdissection: Evidence for K+ Secretion by Duct Cells. Invest. Ophthalmol. Vis. Sci. 47, 1876-1885.
Viret, C. et al. (2003) Self-Specific MHC Class II-Restricted CD4-CD8- T Cells That Escape Deletion and Lack Regulatory Activity. J. Immunol. 170, 201-209.
Yang, T. et al. (1999) MHC class II molecules, cathepsins, and La/SSB proteins in lacrimal acinar cell endomembranes. Am. J. Physiol. Cell Physiol. 277, C995-C1007.