

Author: Alissa Bans
Institution: University of Minnesota and Maria Mitchell Observatory
Date: March 2008
ABSTRACT
Eta Carinae is a massive star known for its diverse population of circumstellar ejecta. One specific component of Eta's ejecta with a radial velocity of -513 km/sec has been found to be conducive to the formation of molecules, and CH and OH have most likely been identified there. We first undertook statistical equilibrium modeling with the most recent version of the photoionization code CLOUDY to find the range of physical parameters that would explain the abundances of the observed species in the -513 km/sec component. With the results of our models as a guide, we searched for additional molecules using the public domain Space Telescope Imaging Spectrograph (STIS) aboard the Hubble Space Telescope. We report a probable detection of C[SUP]1[/SUP]Π-X[SUP]1[/SUP]Σ[SUP]+[/SUP] electronic band of HCl with an estimated column density of 1 x 1015 cm-2. We also estimated the rotational temperature of HCl from observed relative equivalent widths of several rotational components of the C[SUP]1[/SUP]Π-X[SUP]1[/SUP]Σ[SUP]+[/SUP] band to be Τr ≈ 500±140 K. Both observational searches and models of molecular formation in ejecta like this component are deeply informative of the internal workings of an evolved massive star, as well as the chemical enrichment of the interstellar medium.

Table 1: The log of column densities (cm-2) and temperatures (K) for the observed species in the -513 km/sec component from Verner et. al (2005). They were used as a guide in our investigation of probable ranges of physical parameters in the -513 km/sec component with the most recent, improved version of CLOUDY.
INTRODUCTION
Eta Carinae is one of the most massive and luminous stars in our galaxy. Near a mass of 120 Msun and a luminosity of 5x10⁶ Lsun , Eta falls victim to instability in the form of massive eruptions (Hillier et al. 2001). These eruptions so far have not destroyed the star, though it is believed that Eta is in its death throes and very close to becoming a tremendously powerful supernovae (Humphries et al. 2002) .The largest of these non-terminal eruptions occurred around 1840 and not only temporarily made Eta one of the brightest stars in the night time sky but also left in its wake the dusty bipolar nebula referred to as the homunculus (Humphries et al. 2002). A second but lesser eruption followed in 1890. The total mass lost in both eruptions is estimated to be around a few solar masses and currently Eta is approximated to lose 10-3 Msun a year via its intense stellar winds (Humphries et. al 2002).

Figure 2: The predicted column densities (cm-2) for CH, OH, CO, and HCl vs. the silicate grain abundance (ratio of silicates to silicates contained in Orion Nebula) from CLOUDY simulations of Eta Carinae's -513 km/sec component. The carbon to oxygen ratio is fixed at 5.9 and the hydrogen density at 107. 8 cm-3. The dust grain abundance that best reproduces the observations of CH, OH, and CO is 2.3-2.8 times more silicates than in the Orion Nebula. Notice HCl in this regime is comparable to the CH and OH abundances.
Another unique feature of Eta is that the strength of the spectral lines of the surrounding gas change predictably over a period of 5.5 years (Humphries et. al 2002). Thus the widely excepted view is that Eta is actually a massive binary system, which has a corresponding period of 5.5 years to explain the spectroscopic variability (Hillier et al. 2001). Eta is also a source of high energy or hard X-rays, arising from collisions of stellar winds, and low energy soft X-rays, created in a shell surrounding Eta by shock heated ejecta (Verner et. al. 2005).
Though there are many components of the Eta Carinae system worth studying, perhaps one of the most informative studies is that of Eta's surrounding ejecta. Since ejecta like the homunculus are remnants from a fairly recent eruption, studying their chemical composition indicates the composition of the star and thus its evolutionary state. For example, the homunculus and other various ejecta of Eta all indicate extensive processing by the CNO cycle, a fusion process that occurs mainly in highly evolved massive stars with extremely hot cores (Davidson et. al. 1986). Also, the rich ejecta of Eta serve as a case study for the chemical enrichment of the interstellar medium. Currently Eta remains one of the only massive eruptive stars known to be carrying dense molecular gas out in its ejecta (Smith et. al. 2006).
Recently around 20 distinct ejected components in the line of sight toward Eta were discovered using spectra obtained from Hubble Space Telescope Space Telescope Imaging Spectrograph (STIS) (Gull et. al. 2005). One of these ejecta, at a velocity of -513 km/sec, was analyzed with statistical equilibrium photoionization modeling by Gull et al. (2005) and found by the authors to have a temperature of 760 K and be at a distance which places the component near or in the homunculus. Further analysis of the HST STIS spectra indicated the presence of CH, OH and possibly CO in the -513 km/sec ejecta (Verner et. al. 2005).
We can constrain various physical properties of the Eta Carinae system by attempting to replicate these molecular signatures in the ejecta with models. Previous simulations of Eta's ejecta, including that of the -513 km/sec component, have used the code CLOUDY. CLOUDY is a code designed to simulate all the microphysical processes that can occur in astrophysical gasses (Ferland et. al. 1998). The code ultimately predicts the emitted spectrum and thus resulting chemical composition of the gas. These microphysical processes involve an immense network of reactions and such complex physics that no analytic solution is possible, thus simulations are key (Ferland et. al. 1998).
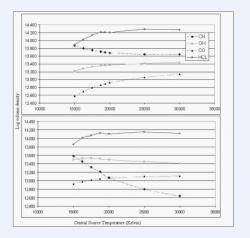
Figure 3: The predicted column densities (cm-2) for CH, OH, CO, and HCl vs. the central source temperature (Kelvin) from CLOUDY simulations of Eta Carinae's -513 km/sec component. The top and bottom graphs have carbon to oxygen ratios of 5.9 and 1.1 respectively. Both models are held at a hydrogen density of 107. 8 cm-3. For a carbon to oxygen of 5.9 a central source temperature near 20,000 K best matches observations, while for a ratio of 1.1 a temperature of only 15,000 K best matches observations. HCl in both cases remains much more prevalent than the other species.
In this study we used a new, improved version of CLOUDY to further model Eta's -513 km/sec ejecta. This new version is augmented with new chemistry, including more chlorine bearing and carbon bearing molecules, such as C2, C2H, and C3. Furthermore, the added reactions of carbonous ions are important for obtaining realistic C2 and C3 abundances. Finally, the condensation of molecules onto grains has been accounted for, which could have a very strong effect in a dusty environment like the homunculus. Thus with this new version of CLOUDY we expect our simulations to give different results than models done with the older versions. In this paper, we used the results of our models to motivate our search for spectral traces of new molecules and to narrow down the probable range of physical parameters in the -513 km/sec ejecta. We found in general that HCl was favored by the models, and made a positive spectral identification of HCl in the HST STIS data.
METHODS
The column densities of CH and OH and the upper limit for CO determined by Verner et. al (2005) are reproduced in Table 1. They were used as a guide in our investigation of probable ranges of physical parameters in the -513 km/sec component with the most recent, improved version of CLOUDY.
The main parameters that affect the molecular abundances are the form of the stellar continuum, the dust grain abundance and extinction caused by dust, the temperature of the central source, atomic abundances (mainly C and O), and the hydrogen number density. Our first simulations assumed a Kurucz model atmosphere at a surface temperature of 15,000 K, a value previously estimated by studies of FeII emission lines in the Weigelt blobs (Verner et. al 2002). Several simulations were also done with the Costar model atmosphere, at a higher surface temperature of 20,000 K. Our simulations assumed a luminosity of 106.7 Lsun for the central source. We also included a blackbody source with a temperature of 3x10⁶ K and a luminosity of 101.48 Lsun to account for the X-ray sources present in Eta Carinae.
Since the central source of Eta Carinae is believed to be highly evolved and subject to partial CNO cycling (Davidson et. al. 1986) the star and its corresponding ejecta are expected to have an overabundance of nitrogen and an under abundance of C and O. Carbon depletion motivated the use of silicate dust; all models used the Orion Silicates option in CLOUDY to represent the dust surrounding Eta. All models also incorporated the effects of the background radiation, including the cosmic ray background, which is an important source of ionization in molecular clouds.

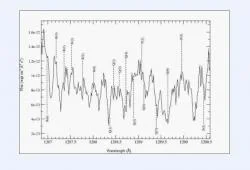
Table 2: The identified HCl lines in Eta Carinae's -513 km s-1 component and the corresponding radial velocities.
Observational data were obtained from the HST Treasury Program on Eta Carinae . We analyzed the Far and Near UV spectra using the high spectral and spatial resolution of the Space Telescope Imaging Spectrograph aboard the HST. In particular, the spectra presented in this paper are from the 3/23/00 Multianode Microchannel Array (MAMA) data with the E140M grating and a spectral resolution of R~100,000, taken with an aperture length and width of 0.2".
We made a probable detection of HCl in the HST STIS data. For this detection, we measured equivalent widths of several strong lines and used those widths along with the oscillator strengths given by Smith et al. (1980) to estimate the column density of HCl on the corresponding rotational levels of the ground electronic state. We also graphically estimated the rotational temperature, Τr. Taking the relative column densities as relative level populations, we used the Boltzman formula, where ni is the population of the i-th level, n1 that of the reference level, gi is the statistical weight of level i, σi is its wave number, and h, c, k are the Planck constant, the speed of light, and the Boltzmann constant, respectively) to relate those levels to temperature.
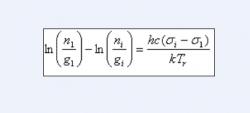
Equation One
Finally, by supposing this temperature characterizes the distribution of the populations of all rotational levels of the molecule in its ground electronic and vibrational state, we estimated the total column density of HCl from the equation (Herzberg 1950, p. 125), where (hcB / kTr) is an approximation for the rotational state sum, B = 10.44 cm-1 is the rotational constant of HCl, and Ni is the column density of any level i.
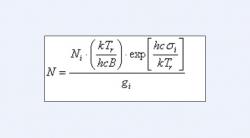
Equation Two
RESULTS
Each result shown in figures 1-3 traces the calculated column densities of CH, OH, CO, and HCl. The first two models shown in Figure 1 test the effects of hydrogen density on the abundances of the molecules. The basic format of the simulations is Kurucz atmospheres with a surface temperature of 15,000 K, a constant hydrogen column density of 1021.8 cm-2, and Orion Silicates that are 2.5 times more abundant than in the Orion nebula. The difference in the two models is the carbon and oxygen abundances. In the first simulation carbon and oxygen are taken to be .1 and .01 solar values respectively (C/O = 5.9). The second simulation takes both at .1 solar (with a C/O ≈ 1.1). Figure 2 demonstrates the effects of the dust abundance on the molecular column densities, where the values on the horizontal axis represent the ratio of the amount of silicates to that contained in the Orion nebula. For this simulation the hydrogen density was held at 107.8 cm-3, C/O ratio at 5.9, and the surface temperature and hydrogen column density were at 15,000 K and 1021.8 cm-2 respectively. Figure 3 shows the effects of the central source temperature on the molecular column densities. The hydrogen density was held at 107.8[/up] cm-3 and the column density of atomic hydrogen was at a constant 1021.8 cm-2. The Kurucz atmosphere was still used and the difference in graphs is the C/O ratio.
The prevalence of HCl in all of our models motivated the search for its spectral signatures in the -513 km/sec component. Figure 4 presents the range 1287-1290 Å in the STIS MAMA spectra from March 2000. We identified spectral features corresponding to the rotational components of the C[SUP]1[/SUP]Π-X[SUP]1[/SUP]Σ[SUP]+[/SUP] electronic band of HCl given by Smith et al. (1980). Figure 4 indicates the various R, Q, P electronic-rotational transitions in the spectra, while Table 2 lists the wavelengths of these transitions and their corresponding radial velocities.

Figure 5: The natural log of column densities Ni vs. the wave number . Here g is the degeneracy and h,c,k are all fundamental constants in cgs units. The transitions R(1)-R(4) and R(6) were used for the graph. The rotational temperature, or the inverse slope of the graph, is 500 140 K.
Performing the analysis outlined in the previous section we were able to estimate the lower limit column density, rotational temperature, and total column density for HCl. Based on the equivalent widths of several of the lines in Figure 4 we find a lower limit column density of HCL to be (1.07 ± .13) x 1015 cm -2. Figure 5 shows a plot of ln(n1 / g1) ln(ni / gi) versus hc(σi σ1) / k for the best measured R transitions. According to equation (1), the inverse slope of this graph gives the value of Τr to be 500±140 K. Finally using equation (2), we estimated a total column density of N(HCl) ≈ 1∙ 1015 cm-2 . For this calculation we used i=3 since the point corresponding to this level is the closest to the least squares fit line shown in Figure 5.
DISCUSSION
From our first two models displayed in Figure 1 we noticed that even though the parameters of these models are very close to those used by Verner et. al (2005), the newer version of CLOUDY indicates that a higher hydrogen density is needed to explain the observations. Whereas Verner et. al (2005) found a hydrogen density of 107 cm-3 to explain their observations of CH and OH, we find an appropriate density range to be 107.5-107. 9 cm-3. In this hydrogen density range HCl has a noticeably high column density; a fact that probably went undetected by previous models due to the lack of chlorine chemistry in the older versions of CLOUDY. Based on the test of the effects of dust abundance (Figure 2) we notice that only Orion Silicates in the range of 1.8-3.2 times more abundant than in the Orion nebula produce results reasonably close to the observations. After a dust threshold of about 1.25 times the Orion nebula silicates, HCl becomes the prevalent molecule in this model. Finally from testing the effect of temperature (Figure 3) we note that the needed central source temperature to produce the observed molecular abundances is highly dependant on the relative abundances of C and O. For C/O = 5.9, higher central source temperatures around 20,000 to even 30,000 K seem to reproduce observations better than temperatures near 15,000 K can. However, the opposite appears to be true for C/O = 1.1; central source temperatures near 15,000 K or even less most easily replicate observations. Finally in these models HCl maintains a high column density between 1014.0 -1014.3 cm-2 for temperatures greater that 16,000 K. The prevalence of HCl in our models supports the likelihood of our detection.
An additional noteworthy study was done to test the temporal variability of Verner et. al's (2005) observed CH lines. We noticed that from January 2002 to September 2003 the general continuum changed by a maximum of 70 percent in the spectral range where the CH lines were found. Incorporating this maximum change into the central source continuum in our models, we noticed that the CH column density only decreased by100.4 cm-2, which is perhaps too small to account for the differences in the January and September spectra. Conceivably, there are additional factors that either dissociate or hide these CH molecules in the September 2003 spectra besides an increase in continuum flux.
The C[SUP]1[/SUP]Π-X[SUP]1[/SUP]Σ[SUP]+[/SUP] system of HCl has most likely been identified in the -513 km/sec ejecta of Eta Carinae. There is also probable detection of the A1Π-X1Σ+ system, though proper analysis was prevented by the lack of published oscillator strengths for the rotational components of this band. With the presented estimates of the column density and rotational temperature of HCl, two important questions that require further exploration come to mind. First, why is the observed column density higher than those predicted by most of our simulations (on average, by an order of magnitude)? One possible reason for this particular discrepancy could be the temporal variability of the source. Our models were calculated to match CH and OH observations from January 2002, and our HCl observation is from March 2000. The second question worth noting is: Why is there such a wide difference in temperatures found in the -513 km/sec ejecta? The rotational temperature found in this paper, 500 ± 140 K, is higher than the proposed temperature of the homunculus: roughly 140 K in outer shell and 200-250 K in the inner shell (Ferland et. al. 2005). The 760 K temperature found by the modeling of TiII observations from Gull et al. (2005) is also much greater than the predicted homunculus temperature. The CH observations from Verner et al. (2005) indicated rotational temperatures only around 30 K. These large variations could be explained by clumpy structure, or inhomogeneous density distribution within the ejecta. Much more research should be done to explore the effects of clumping in this ejecta and perhaps the entire homunculus.
Overall, detailed statistical equilibrium modeling of chemistry in Eta Carinae's -513 km/sec ejecta indicates that there is a wide range of physical parameters able to explain the recently observed molecules. CH, OH and CO abundances have been shown to be heavily dependant on the dust abundance, hydrogen density, and even central source temperature. Despite these varying parameters, some molecules in the simulations remain relatively constant in column density. For example, HCl's steady and high column density motivated our search for it. We propose a search for other molecules in the -513 km/sec ejecta that behaved similarly to HCl in our simulations; that is molecules that have a relatively high constant column density throughout various models. We advocate searches for N2 and CH2. Though they are not quite as abundant as HCl in our simulations, they remain comparable in abundance to CH and OH. Finding molecules in the ejecta of a star like Eta is truly an anomaly, discovering more about this unlikely chemistry aids in our understanding of this enigmatic object.
ACKNOWLEDGMENTS
This project was supported by the NSF/REU grant AST-0354056 and the Nantucket Maria Mitchell Association. This research has also made use of the data archive for the HST Treasury Program on Eta Carinae (GO 9973) which is available online at http://etacar.umn.edu. The archive is supported by the University of Minnesota and the Space Telescope Science Institute under contract with NASA.
REFERENCES
Davidson, K., Dufour, R., Walborn, N., & Gull, T. 1986, ApJ, 305, 867.
Ferland, G.J, & Abel, N., Davidson, K., Smith, N. 2005, ASP Conf. Ser.
Ferland, G.J, Korista, K.T, Verner, D.A, Ferguson, J.W, Kingdon, J.B, & Verner, E.M. 1998, ASP, 110, 761.
Gull, T.R., Kober, G.V., & Nielsen, K.E. 2006, ApJ, 163, 173.
Gull, T.R., Vieira, G., Bruhweiler, F., Nielsen, K.E., Verner, E., & Danks, A. 2005, ApJ, 620, 442.
Herzberg, G. 1950, Molecular Spectra and Molecular Structure (Krieger Publ. Co.: Malabar, FL).
Hillier, D.J., Davidson, K., & Ishibashi, K., & Gull, T. 2001, ApJ, 553, 837.
Humphries, R., Davidson, K., & Smith, N. 2002, ASP Conf. Ser. Vol. 279.
Smith, N., Brooks, K.J., Koribalski, B.S., & Bally, J. 2006.
Smith, P.L., Yoshino, K., Black, J.H., & Parkinson, W.H. 1980, ApJ, 238, 874.
Verner, E., Bruhweiler, F., Nielsen, K.E, Gull, T.R., Kober, G.V., & Corcoran, M. 2005b, ApJ, 629, 1034.
Verner, E., Gull, T.R., Bruhweiler, F., Johansson, S., Ishibashi, K., & Davidson, K. 2002, ApJ,581, 1154.