

Author: Sukruti Ponkshe
Institution: University of Illinois- Chicago
Date: June 2008
ABSRACT
Millions of people suffer from various diseases of the central nervous system such as stroke, Parkinson's disease, Alzheimer's disease, and hydrocephalus. To improve the treatment options available, a better understanding of the intracranial dynamics is required. The understanding of intracranial dynamics leads to quantification of fluid flow, cerebrospinal blood pressure, and extension of brain vasculature during the cardiac cycle. One such quantification method, used to simulate the physiological conditions in the brain, is the computer program MATLAB, and one proposed approach is using a "compartmental" model, where arteries, veins, choroids plexus, and other areas and vessels in the brain are lumped as compartments to simulate the intracranial dynamics under normal and hydrocephalic conditions. A dynamic model, built on previous work with additional compartments, compiled in MATLAB, was used to compare the validity of the previous models. In addition, a network model was generated using the principles of the compartmental model. The model was used to accurately predict normal pathological conditions of blood flow through the brain. The results generated using the model generator and the MATLAB program were very similar to the normal physiological values stated in literature. Thus, the mathematical model is consistent and can be used to simulate other pathological conditions of the brain such as hydrocephalus to gain a better understanding of what occurs in such diseases, allowing us to properly treat such pathological conditions.
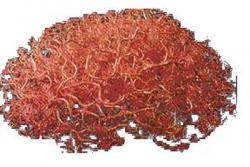
Figure 1. Brain vasculature of the human brain.
INTRODUCTION
Background
Researchers have used the concept of compartmental models to represent the brain vasculature. Compartmental models group many similar blood vessels, such as numerous arteries, into one bundle, known as the arterial compartment. One of the proposed approaches for quantification would be to represent similar vessels as a bundle of tubes (Zagzoule and Marc-Vergnes, 1986). The bundles of tubes represent the separate individual compartments in the compartmental model. In 1988, Karni et al. expanded Monro's first model of the intracranial cavity, which consisted of two compartments: brain and blood, both as incompressible phases (Sorek et al, 1988a). Karni modified the model to have three compartments: the brain, arteries, and veins. This model was further enhanced to contain six fluid compartments: arterial, capillary, venous, venous sinus, jugular bulb, and cerebrospinal (CSF) (Sorek et al, 1988b). To refine the model, Karni, Sorek, and Bear decided to add an additional component, brain tissue, to the preexisting six compartments model (Sorek et al, 1989).
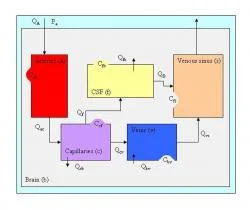
Figure 2. Compartmental model based on previous work.
For the current study, a six compartmental model consisting of the brain, arteries, CSF, venous sinuses, capillaries, and the veins, based on previous work will be compared to a more advanced model, containing nine compartments to determine the validity of the models. Using the different parameters for normal and hydrocephalic conditions, the models are simulated using MATLAB to determine the change in pressure and volume over time for the various compartments. The primary objective is to quantify blood flow, cerebrospinal blood pressure, and extension of the brain vasculature during the cardiac cycle. The understanding of the intracranial dynamics is required for the quantification of blood flow, cerebrospinal blood pressure, and extension of the brain vasculature. In addition, a network model based on the compartmental model concept was also developed and used. The compartments were treated as tubes, bifurcations, and unions and used to determine pressures, flow rates, and change in areas of the vasculature over time for each tube.

Figure 3. New proposed model with nine compartments and volume consistency.
Motivation
Millions of people suffer from various neurological conditions such as stroke, Parkinson's disease, Alzheimer's disease, and hydrocephalus (NIH, 2005). To improve the treatment options available, a better understanding of the interactions between blood, cerebrospinal fluid (CSF), and soft brain tissue, which are known as the intracranial dynamics, is needed. Experimental studies have been unable to provide answers for effective treatments and diagnosis of such pathological conditions; therefore, mathematical modeling is applied to better understand the intracranial dynamics and the vascular system (Penson and Allen, 1999; Ursino et al, 1997). Current models fail to represent the vasculature and intracranial dynamics during the normal cardiac cycle. The motivation for the development is to bring about changes in diagnosis and treatment of various brain diseases. The investigation of moment transfer between blood and CSF and transport molecules in the brain can lead to development of effective drug processes that can transport and administer the drug at specific sites for use in prevention of cancer tissue development and neural growth around the cancerous tissue (Basile et al, 2006). Furthermore, the understanding of the brain vasculature and its properties can be used to provide valuable information for surgeons. The computer simulations can be used as esthetics and can provide a surgeon with a better perspective as to how much blood flow would be reduced and how much vasculature would be removed with the removal of a certain amount of tissue. This modeling of the vasculature is known as Computer-aided Diagnosis (CAD) (Selle et al, 1991). Also, a 3-D reconstruction makes it easy to detect abnormalities in the bifurcation structures of the vasculature, which tend to a higher risk for complications (Selle et al, 1991). In addition, the developments could lead to better diagnosis and treatment methods for various pathological conditions like hydrocephalus (Linninger et al, 2005).
Methods describing the mathematical equations and balances applied to the system will be discussed along with the results obtained from the mathematical model.

Figure 4. Total network model composed of blood and CSF compartments.

Figure 5. Total network model depiction generated by the model generator.
METHODS
Model Based on Previous Work
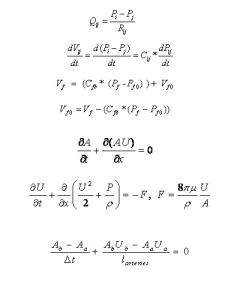
Modeling of every artery, vein, capillary, and the microvasculature in the brain is a tedious procedure, and the vasculature of the human brain resembles a knotted ball of yarn (Figure 1). It is impossible to account for all the veins, arteries, capillaries and other blood vessels in the brain separately. A simplified compartmental model, based on previous models of Karni and Stevens (Figure 2) simplifies the problem. All the arteries, which are considered to be similar, are lumped together as one. This artery bundle is defined as the arterial compartment of the compartmental model. Similarly, all the veins are lumped together and so are all the capillaries thus resulting into formation of vein and capillary compartments, respectively. Other compartments used are venous sinus, brain, and ventricles (CSF compartment). Mass and moment balances are used to determine the flow, pressure, and volume differences in the system. The mathematical relations between the compartments are used to determine various flow rates. This is calculated with the pressure driven flow rate equation, where i,j represents flow from compartment i to compartment j. P represents the pressure in the compartment, Rij represents the resistance that the fluid experiences to go from compartment i to compartment j.

Figure 6. Network Model Blood compartments.
The compliance (deformation) of the membrane is taken into account by an equation that relates pressure difference and compliance, C, to the volume change of the compartment.
Cij is the compliance between compartment i and compartment j.
The mass and moment balance equations, along with boundary conditions and other known parameters are used to compile a MATLAB code. The MATLAB code contains initial volume quantities, the Qf (the flow rate in), compliance values, and the initial pressure values. New pressure values at different time steps are calculated in separate functions, which act as subroutines in the program.
The new volume of the ventricle compartment (Vf), after a certain time span is given by multiplying the pressure difference (Pf - Pf0) by the compliance (Cfb) and adding it to the initial ventricle compartment volume (Vf0).
The original volume of the ventricle compartment is determined by subtracting the volume change due to the compliance from the final volume. In order to notice the minor changes in the CSF compartment volume, the CSF compartment volume versus time is plotted as a separate graph. Also, a volume comparison graph is plotted that shows the changes in the volume over time in the brain compartment and the CSF compartment from the initial to the final time step. Furthermore, a pressure versus time graph is plotted.

Figure 7. Network model generated by the model generator for the blood system.
New Model Methods
The new model is also derived from previous work but has additional components to it and it is based on fluid mechanics principles (Zagzoule and Marc-Vergnes, 1986). As seen in Figure 3, the new model consists of nine compartments: arterial, capillaries, veins, venous sinus, ventricles, choroid plexus, brain, subarachnoid space, and the spinal cord. This model distinguishes between the blood flow and the CSF flow in the brain. The model assumes that the fluids are incompressible but they can be displaced. The enlargement of a compartment in the subarachnoid space has to equal the sum of the decrease in volumes of the other compartments. The spinal cord is an exception because it is not physically in the subarachnoid space. It is compliant with the body rather than the rest of the brain and its compartments. The model in Figure 4 is more like a network of tubes rather than compartments. The network model is based on the principles of the compartmental model and uses balances to solve the system of equations. The continuity equation, a material balance, is used to balance flows entering and leaving each tube. Also, a momentum balance is used to relate the pressure difference to the frictional term, alpha, and the flow rate into the tube. A network representation of the proposed model (Figure 4) developed by the model generator is shown in Figure 5.
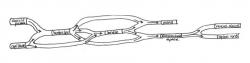
Figure 8. Network Model CSF compartments.
The continuity equation and momentum equations are used to derive the tube law. The tube law or distensibility of the vessel equation is used to relate the pressure difference in the tube and the surrounding compartment to the elastance of the compartment and the change in area; thus exemplifying the distensibility and extension of each tube. For example, let us consider the arterial compartment only, shown in Figure 6 and the produced network from model generator shown in Figure 7.
Blood flow through the Arterial compartment
In the continuity equation for the arterial compartment, Iarteries is the length of the arterial compartment. In equation (7), the partial derivative of A with respect to t, represents the partial derivative of the area over time. The change in area over time results in the change in velocity times the distance of the fluid, which is analogous to the change of flow rate. The partial derivative of the quantity AU with respect to the position, x, see equation (5), is used to give the flow rate over time.

Figure 9. Volume over time for a period of 150 min.

Figure 10. CSF compartment volume over time for a period of 150 min.
Finally, in the distensibility equation for the arteries, P* is the pressure of surrounding tissue area. However, in the developed model network generator we use a rather simplified form of equations. For steady and dynamic state condition, the simplified material balance used for the arteries and the moment balance for the arteries are used.
The pressure difference is equal to the resistance coefficient, α, times the flow to the respective compartment. In the distensibility equation, the pressure difference between the arteries, PA, and the surrounding compartment pressure, Pbrain, is related to the arterial elastance, E, times the change in its cross sectional area of the arteries.

Figure 11. Pressure over time for a period of 150 min.
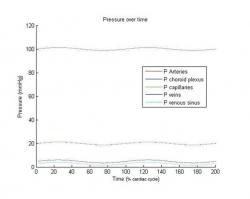
Figure 12. Pressure in the blood flow compartments over time for two cardiac cycles.
Bifurcations existing in the model also need to be accounted for. A bifurcation occurs when one tube or vessel divides into two separate branches. For example, the artery branches into two tubes, the choroid plexus and the capillaries. A material balance, flow out from the first branch equals the flow into the second branch plus the flow into the third branch. To solve bifurcation 1, which is the bifurcation from arteries to choroid plexus and capillaries, as seen in Figure 6 and Figure 7, the following equations are used:
For unions, a material balance as well as a pressure equation is written. Unions are when flows from two tubes combine to form one tube. The example below shows equations for the union of one of the choroid plexus branch and the capillary branch.
The flow from tube three plus the flow out from tube one combine to form the flow in for the capillaries, and defines the pressure relationship.
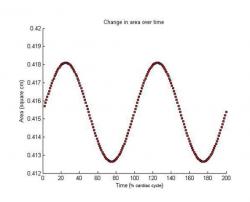
Figure 13. Change in area of a blood flow compartment over time for two cardiac cycles.
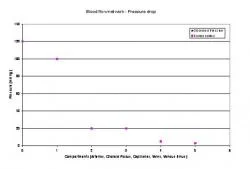
Figure 14. Pressure drop across the blood flow system
In order for the two tubes to unite, the pressure in each of the two tubes has to be equal. Thus, using these rules and applying them for all tubes, bifurcations, and unions, the equations for the entire system are generated using the model generator and coded in MATLAB to produce the results discussed in the results section.
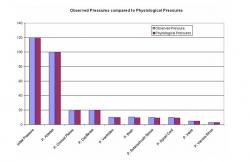
Figure 15. Pressure drop across the entire system and comparison with physiological data.
Figure 6 represents the blood flow network, the flow in red, and the compartments that are associated with the blood flow. Figure 8 represents the CSF flow, black arrows, through the brain and its components. The two (Figure 8 and Figure 6) are then combined to form Figure 4 that shows the distinct blood and CSF flows through each of the vessel. The continuity, momentum balance, and tube law equations are applied to each tube along with the bifurcations and union equations to solve the entire network. The Kellie-Monroe doctrine is applied to the system as an additional equation that enforces constant volume of the whole system at each time step since the cranium has a fixed volume.

Table 1. Relationships used for the compartmental model and its electric circuit analogy.
Electrical Analogy
An electric circuit analogy to the network model can be established as well. Each tube represents a resistor (Tsakiris and Linninger, 2002). Each vessel, the original nine compartments, is a resistor with a grounded capacitor in series. A resistor is used to represent the resistance experienced by the fluid to travel from one compartment to the next. The capacitor in series is required for the nine compartments because a capacitor will be charging or discharging depending on the current flow. This is required to correctly model the distensibility of each tube. The initial flow is equivalent to an alternating current source.
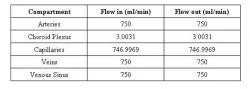
Table 2. Flow rates in and out of each compartment of the proposed model.
Table 1 shows the elastic tube and its electrical analogy as well as the relationships used to solve the electric circuit analogy. In the circuit analogy, the current is analogous to the flow, the change in pressure corresponds to the voltage drop and the alpha relates to the resistance R of the resistor in the circuit (Tsakiris and Linninger, 2002). The equations used to solve the electric circuit are Kirchoff's rule and Ohm's law. The material balance, exemplified by the equation (7), can be written for an electrical circuit as seen in equation (16).

Table 3. Area change in the compartments of the proposed model.
The momentum balance, represented by equation (8) is analogous to the electric circuit version, equation (17). Furthermore, the accumulation of the volume is similar to the charging of the capacitor equation, equation (18).
For bifurcations, the material balance where flow in has to equal flow out is analogous to a current split at a node. The current going into the node has to equal the total of the currents that split off at that node. For unions, the pressures in the two tubes have to be equal. Voltage drops across the two nodes represent the equal pressures in the tubes. The voltage drop across the two nodes in a parallel circuit has to be equal, similar to the equal pressures for the unions of two tubes. Thus, an electric circuit analogy can also be used to understand the network model.
Equations 1-7
RESULTS
The initial model based on previous work (Sorek et al, 1988a) implemented in a MATLAB code produced results with noticeable changes in volume and pressure. Over time, the brain compartment volume decreases by about 22ml and the ventricles increase in volume by a similar amount. While the total volume of all compartments stays almost constant, a steady decrease in the brain compartment volume is seen in Figure 9. Figure 10 shows the CSF compartment volume graph, which exhibits a non linear volume increase from an initial volume of 30ml to a final volume of about 52.5 ml. The pressure over time graph reveals a 13 fold pressure increase in the ventricles (Figure 11). The pressure rises from 10mmHg, initial pressure, to a final pressure of about 130 mmHg. Even though the results from this model look consistent, the model has significant volume discrepancies for large time spans. This is due to the fact that the Kellie-Monroe doctrine is not enforced in the model. The new proposed model incorporates an additional equation that accounts for total volume consistency not satisfied by previous developed models (Sorek et al, 1988a; 1988b; Stevens, 2000).
Network Model Results Blood Flow Results
Using the equations generated by the model generator, the blood flow case study shows the physiological patterns that occur under steady state conditions. The network in Figure 5 was used to generate equations using the model generator and implemented into a MATLAB program. The obtained results are seen in Tables 2 and 3. Table 2 shows flow in and out of arteries is 750 ml/min. Flow in and out of Choroid Plexus is 3.0031 ml/min. 746.9969 ml/min flow in and out of the capillaries at a given time. The veins and venous sinus receive an input of 750 ml/min and output a flow of 750ml/min as well. Table 3 shows the change in area over time for the various compartments. It shows the initial and final areas, measured in square centimeters, for arteries, choroid plexus, capillaries, veins, and venous sinus.

Equations 8-19
Dynamic State Results
For the blood flow under dynamic condition, the results are displayed graphically in Figure 12 and Figure 13 for normal dynamics. Figure 12 shows the change pressure for each of the five major compartments, the arteries, choroid plexus, capillaries, veins, and venous sinus. Figure 13 shows the change in area of the arterial compartment over time in the dynamic state. A slight reduction in the area of the compartment, beginning area compared to the final area, is visible. As displayed on the pressure over time graph, the pressure in the arteries is seen to be about 100mmHg, the pressure in choroid plexus and capillaries is about 20mmHg, pressure in the veins is approximately 5mmHg while the pressure in the venous sinus is 3mmHg as also depicted in Figure 14. The pressure drop for the entire network is seen in Figure 15 and is compared with physiological data (Sorek et al, 1988a; 1988b).
DISCUSSION
In order to provide effective treatment for major illnesses such as hydrocephalus, it is necessary to better understand what part/parts of the brain are affected and how. Therefore, we developed a computer model that shows how such diseases affect the brain and its vasculature. The use of compartmental models as a base to start with and developing it to a network model and simulating such pathological conditions in MATLAB enabled us to verify the validity of our model.
To model the body's dynamics, a sinusoidal input is used instead of a constant input value shown in equation (19).
The volume over time graph shows the volume for six different compartments: brain, arteries, ventricles, capillaries, veins, and sinus. Over time, the volume of the arteries, capillaries, veins, and sinus compartments remains constant. However, the volume in the brain and the ventricles compartment changes. The volume in the ventricles compartment increases over time, while the volume in the brain compartment decreases. The volume increase and decrease in the two compartments are almost equal and the total volume of all the compartments remains almost unchanged for small time frames.
The change in the ventricles compartment volume is the result of a greater resistance in the outflow to the brain compartment and the venous sinus. In the mathematical modeling in order to produce a pathological condition like hydrocephalus, the impedance, the inverse of the resistance, is decreased. The flow output to the brain compartment and venous sinus are decreased dramatically by decreasing the impedance between the two compartments. This models the hydrocephalic condition in the human brain. Therefore, due to low impedance, the volume accumulates in the CSF compartment, while the flow into the brain is decreased and thus a decrease in the volume is noticed. Even though the CSF compartment has a flow into the venous sinus, the volume of venous sinus remains unaffected because of its two inputs. The decrease in the influx from the CSF compartment is balanced by the input from the venous compartment, thus, the volume of the sinus compartment remains unchanged.
The pressure increase in the CSF compartment is significant. The pressure increases from an initial value of 10.0148 mmHg to a value greater than 130 mmHg, which is 13 times greater than the original pressure in the compartment. The volume in the CSF compartment increases from 30 ml to approximately 52 ml. The change of 22 ml, 1.73 times greater, is not as drastic as the pressure increase. The presented model based on previous work can qualitatively predict pathological conditions like hydrocephalus but it cannot conserve total volume of the cranium. Additional constraints need to be incorporated in the model so as volume consistency of the system is satisfied. We propose a new model based on a model generator and obeys to first principles, continuity, momentum and distensibility equations, eqs. (10)(12) and also satisfies volume consistency. This model describes accurately the intracranial dynamics of the brain.
Results based on the Network Model
In steady state condition, there is no accumulation of volume in any compartment and the flow in and out of the compartment is equal. Also, a pressure decrease from compartment to compartment is noticed, which is consistent with physiological conditions and required for the fluid to flow from one compartment to the next. A slight variance in the cross sectional area is recorded for each vessel as well.
Blood Flow Network Results
In steady state, the volume in a compartment has to equal the volume out. As Table 2 shows, for each compartment the flow in equals the flow out. The values from Table 3 show that the arterial, choroid plexus, and the capillary a minor increase in the areas is seen over time, while the veins and the venous sinus areas decrease slightly over time. The increase and the decreases are balanced when all other non major tubes are also taken into consideration. This means that there is no increase in area over time, which is physiologically consistent.
A pressure drop is also noticed in the results generated by the MATLAB code. The pressure drops from a blood pressure of 120mmHg, to 100.051 mmHg in the arteries, to 20.466mmHg in choroid plexus, to 19.966mmHg in capillaries, to 4.7416mmHg in veins, to 2.7391mmHg in venous sinus. These results can be verified using physiological values (Sorek et al, 1988a). The physiological values are 100mmHg for arteries, 20mmHg for choroid plexus and the capillaries, 5mmHg for veins, and 3 mmHg for venous sinus. The values predicted by the proposed model are close to the actual physiologically observed values (see Figure 15).
Figure 12 shows the dynamic pressure over time for each compartment. The pressure for each compartment exhibits a sinusoidal behavior. The sinusoidal pattern is a result of the given sinusoidal input, which is consistent with the cardiac cycle in the body. Figure 13 shows the change in area of a compartment over time. The change in area of the compartment also exhibits a sinusoidal behavior because of the given sinusoidal input, consistent with the cardiac cycle. The area decreases slightly over time as a result of the change in pressure in that compartment with respect to the flow in and out of the compartment. The presented results verify that the model is able to properly generate results consistent with physiological data. In these simulations the total volume of the system remained constant for large time periods.
CONCLUSIONS
Previous models based on older work are not physiologically consistent. First of all, they tend to consider only steady state while the human body is not at steady state. These models have a change in the total cranial volume, which is inconsistent since the cranial space is considered to be fixed in adult humans and cannot increase or decrease in volume. Furthermore, previous compartmental models are used to generate the desired disease from conditions that predetermine the desired pathological condition. For example, previous models (Sorek et al, 1989; Stevens, 2000) use the input of the pressure in the arteries, veins, and all other compartments. However, the proposed model solves all the pressures, change in areas, and flow rates based on just the initial areas, initial flow in the system and the initial pressure by solving a set of linear equations explained also by electrical RC circuits. The network model produces physiologically consistent results that can be verified by other work done in the field. It displays the flows and pressures in the compartments as a sinusoidal graph, which is consistent with the cardiac pulse. The model is able to exhibit a change in the area over time and display an increase in the area of some compartments while the area in the other compartments decrease. The total volume of the system remains constant for long simulation times and the model can accurately and precisely simulate physiological conditions.
Future Directions
Imaging techniques such as MRI can only determine hydrocephalic conditions once the ventricle are already enlarged; the developed network model based on first principles of fluid mechanics, can be used to understand normal intracranial dynamics and the causes that lead to hydrocephalus. Better understanding of the fluid flow dynamics can lead to earlier detection and better treatment options than the current treatment, the shunt placement, which just diverts the excess CSF in the ventricle to another part of the body. Current treatment options are very expensive and prone to failure (Patwardhan and Nanda, 2005). The developed model could be also used to determine the after effects of a stroke or a tumor growth in the brain extracting dynamic results for the pressure in the brain, flow rates and volumes in the vasculature, and ventricles and its effect on blood flow to each individual compartment.
Some of the shortcomings of the present study are that all the vessels such as arteries and veins are lumped into one arterial and one venous compartment. The surface area of these compartments can change based on the network of arteries and veins that are spread out all over the brain. Furthermore, this work is currently only been applied to normal physiological conditions but it needs to be tested and verified that it works and produces a hydrocephalic condition with pressures and flow rates that have been verified physiologically. Also, such work needs to be integrated with simulation programs that show take the data and generate computer models that show the pulsating brain along with the vasculature and is able to show the effects of raised blood pressure or hydrocephalic conditions. Such modeling and simulations can help surgeons better diagnose and treat diseases or accidents that lead to brain damage. Currently, a surgeon would be required to understand numbers that are output of a computer program and relate it to the various areas of the brain. This can lead to mistakes and misunderstanding of the effects and lead to mistreatment.
ACKNOWLEDGEMENTS
I would like to thank the NSF-REU site at University of Illinois Chicago and the Department of Defense for the funding. I would also like to thank my advisors Professor Andreas Linninger and Dr. Michalis Xenos. Finally, I would like to thank everyone in the lab for helping me out with any questions I had.
REFERENCES
Basile J.R., Castilho R.M., Williams V.P., Gutkind S., Semaphorin 4D provides link between axon guidance processes and tumor-induced angiogenesis, PNAS, June 13, 2006, 103 (24), 9017-9022.
Linninger A.A., Tsakiris C., Zhu D.C., Xenos M., Roycewicz P., Danziger Z., and Penn R., Pulsatile cerebrospinal fluid dynamics in the human brain, IEEE Transactions on Biomedical Engineering, 2005, 52(4), 557-565.
NIH, NINDS, 2005, www.nih.gov.
Patwardhan R., Nanda A., Implanted Ventricular Shunts in the United States: The Billion-Dollar-A-Year Cost of Hydrocephalus Treatment, J. Neurosurgery, January, 2005, 56(1), 139-145.
Penson R., Allen R., Intracranial hypertension: condition monitoring, simulation and time domain analysis, Engineering Science and Education J, February, 1999, 33-40.
Selle D., Spindler W., Preim B., Peitgen H., Mathematical models in medical imaging: analysis of vascular structures for liver surgery planning. Fluid Dynamics in Biology Proceedings of an AMS-IMS-SIAM joint Summer Research Conference. July, 1991.
Sorek S., Bear J., and Karni Z., A non-steady compartmental flow model of the cerebrovascular system, J. Biomechanics 1988a, 21, 695-704.
Sorek S., Feinsod M., Bear J., Can NPH be caused by cerebral small vessel disease? A new look based on a mathematical model, Med Biol Eng Comput., May, 1988b 26(3), 310-313.
Sorek S., Bear J., and Karni Z., Resistances and Compliances of a Compartmental Model of the Cerebrovascular System, Ann Biomed Eng., 1989, 17(1), 1-12.
Stevens S.A., Mean Pressures and Flows in the Human Intracranial System, Determined by Mathematical Simulations of a Steady-State Infusion Test, Neurological Research, 2000, 22, 809-814.
Tsakiris C., Linninger A.A., Egnor's Model of the CSF Flow in the Human Brain, UIC-LPPD-101102, Oct., 2002.
Ursino M., Lodi C.A., A simple mathematical model of the interaction between intracranial pressure and cerebral haemodynamics, American Physiological Society, 1997, 1256-1268.
Zagzoule M., Marc-Vergnes J., A global mathematical model of the cerebral circulation in man, J. Biomechanics, 1986, 19, 1015-1022.