

Author: Heather Horobik
Institution: Florida State University
Date: May 2007
ABSTRACT
Archaeological surface survey is a useful, nondestructive tool for understanding the past. However, within various documents, archaeologists question the accuracy of surface artifacts to reflect the subsurface site. If surface materials mirror the site below ground, the patterns of surface artifact distribution would give archaeologists helpful insights. This project evaluated the uses, limitations, and results of archaeological site surface survey using survey data obtained from the Hungarian Copper Age site of Körösladany 14 during 2005. The survey data was combined with spatial information using a geographic information system database to map the density and distribution of surface artifacts and to predict the subsurface site. The predictions were then compared to results from the magnetometry, soil chemistry analysis, and 2005 excavations. The conclusions of this research were that the surface data does not reflect the site below ground perfectly and that site survey raises many questions which can only be answered through other means.
INTRODUCTION
The archaeological process begins by defining a research question or area of interest. To answer questions about past societies, archaeologists need to find and interpret material remains. Field archaeologists use surveys to find and conduct initial studies on archaeological sites. In the most general sense, the term survey, when applied to archaeology, can be described as the non-destructive inspection of a geographical area for evidence of previous human use or occupation such as artifacts and other cultural features (houses, pits, hearths, etc.). Many types and variations of archaeological survey exist to accomplish different tasks and research in different circumstances.
This paper focuses specifically on full coverage systematic site surface survey and its value as an archaeological tool. This type of survey entails a systematic visual inspection of cultural features and the collection and documentation of all artifacts on the surface of a site. Site surface survey is used for various purposes such as finding site boundaries and studying the distribution of artifacts (Renfrew and Bahn 1991). By examining the data from the artifacts and features, archaeologists gain better knowledge about a site.
As this article's title indicates, the accuracy of predictions based on the analysis of site surface survey data has been questioned. Many factors that contribute to the artifacts' journey to the surface of the site may displace or favor certain artifacts. These factors include but are not limited to the depth of the site, the slant or slope of the site, erosion, and human and animal disturbance (Renfrew and Bahn 1991; Ammerman 1985).
In this case study, agricultural plowing was one of the factors considered. As a common agricultural practice, plowing is often considered in the displacement of artifacts in agricultural areas. In his article on the effects of plowing on the distribution of ceramic tiles in Calabria, Italy, Ammerman (1985) states that surface material in plowed areas move gradually over time by continuously cycling within the plow zone (the layer of the soil affected by agricultural plowing of cultivated lands). He continues by comparing the surface material to "the tip of the iceberg" because the constant cycling allows only a small percentage of material to be visible at any time (Ammerman 1985). So not only do the artifacts continue to move around through the soil, but the surface distribution of certain artifacts also has the ability to change. Another study, performed in Michigan, resulted in random variations in surface artifact distributions. The researcher recommended that archaeologists conduct multiple site surface surveys of cultivated areas to gain any substantial conclusions (Shott 1995). These studies about the effects of plowing on surface artifact distribution illustrate that, due to the various factors at work on a site, the surface can only offer a remote picture of the subsurface site. The effects of plowing and other factors on archaeological sites were carefully considered during this project.
A brief explanation of the archaeological importance of Körösladány 14 (K-14) is essential to understand this project. The early Hungarian Copper Age people have been identified as a tribal people with an egalitarian or non-ranked society (Parkinson 1999). Around 4500 BC (the end of the late Neolithic and the beginning of the early Copper Age), the people of the Great Hungarian Plain experienced many cultural changes (Parkinson et al. 2004). Shifts in practices reveal that the number of culture groups present on the Great Hungarian Plains went from three culture groups in the Late Neolithic to one, the Tiszapolgar, in the Early Copper Age (Parkinson 1999). Much of the recent research on the Great Hungarian Plain has been conducted by the Körös Regional Archaeological Project (KRAP), cooperative Hungarian and American multi-disciplinary team dedicated to learning more about this period and causes for the transition.
K-14 is the current KRAP excavation site. Prior to the 2005 summer excavations, some initial research was undertaken including regional and site surface surveys, soil-phosphate testing, and remote sensing. During the mid-twentieth century, the Hungarian Institute of Archaeology began an attempt to find and document all archaeological sites using the method of intensive regional surface survey (Parkinson 1999). The K-14 site was among the many Copper Age sites discovered. In the late 1990's, Parkinson used the Archaeological Topography of Hungary to find and survey sites for his doctoral dissertation research, including K-14. In the summer of 2003, KRAP had Apostolos Sarris conduct a remote sensing survey using magnetometry. All of these surveys contributed to the limited amount of knowledge about the K-14 site prior to the 2005.
During the summer of 2005, the KRAP conducted a full coverage systematic site surface survey at K-14. The results of this survey were used in attempt to discover what cultural remains and features lay beneath the surface of the site. Using the survey data in this manner raised questions about the efficiency of site survey and the accuracy of surface artifacts' ability to reflect the subsurface site. A hypothesis stating that surface data could not be relied on to produce precise information about the subsurface site was created. This paper examines the uses, limitations, and results of archaeological site surface survey through the analysis of the K-14 surface artifact density and distribution data illustrated by GIS maps.
Geographic information system (GIS) databases were created by combining the artifact distribution data with spatial information. These GIS databases allowed surface artifact density and distribution maps to be produced and analyzed. Further into research, a model of possible subsurface cultural features was also created. This model and the earlier maps were compared with the results of the 2005 excavations, soil chemistry analysis, and the magnetometry survey -- the detection of subsurface magnetic shifts which can indicate ditches, hearths, kilns, pits and metal artifacts. This additional information provided a glimpse of the subsurface remains. While some cultural features appeared to be accurate, others did not correlate with magnetometry and excavation results. The K-14 analysis attempted to measure the accuracy of a single site surface survey and draw conclusions about effects on the artifact distribution.
METHODS AND MATERIALS
Survey Methods
The 2005 K-14 full coverage systematic site surface survey was performed to gain more information before commencing excavation. A grid was created by dividing an area of 1,155 square meters of plowed agricultural land into 231 units measuring five square meters. Participants of the KRAP field school, including both inexperienced and experienced surveyors, conducted this survey. Surveyors collected every surface artifact found in each unit. Collected artifacts from each unit were identified, sorted, bagged, and recorded by artifact type: lithic, ceramic, bone, daub (chunks of burned or heated earth, similar to ceramic material, formed in areas like hearths, kilns, burnt houses, etc.) and other types of artifacts. Later these artifacts were cleaned, further analyzed, and documented.
Research Methods and Materials
The examination of artifact distributions included several different steps in an attempt to draw the best conclusions from the data. The original focus was on the patterns and clusters in the artifact data based on the weight of the collected samples and the possible reasons for those patterns and clusters. A data table listing all collected artifacts and the GIS maps created by Meg Morris, a graduate student with KRAP, were reviewed. These original GIS maps illustrated the distribution of the individual artifact categories by weight. After high concentrations and clusters of artifacts were located by studying each map, consideration was given to how such patterns could occur during the creation, use, and disposal of each type of artifact.
For the purpose of this project, other maps were created using ESRI ArcGIS 9. These maps displayed individual graduated values for the different distributions of both the weight and number of each type of artifact. These value categories were based on ArcMap's generated distribution histograms. The fewer value categories on the new maps revealed more dramatic variations in the densities and distribution.
Despite these maps, difficulty still existed in comparing the distributions for more a detailed analysis of smaller less obvious clusters and combinations of the categories to one another. In response to this problem, a model was created using queries for units with specified combinations of artifacts. Attribute queries commanded the computer program, ArcGIS, to identify the individual units with the specific quantity, amount, or combination of artifacts. Queries were based on the surface data around excavated areas, research, and lectures at the field school. The results showed which units may be above a certain subsurface feature based on the distribution and density of artifacts within it.
Queries for middens (trash areas) specified units with concentrations of artifacts that would be expected in Copper Age trash: a presence of bone, above average density of ceramic sherds, and a significant sample of daub. As the process of firing clay would heat the soil and possibly cause some pots to explode, the label kiln was given to units with above average ceramic and daub concentrations. Since most people keep a relatively clean living space, house queries involved little or no bone presence and low ceramic and daub concentrations while burnt houses used the same query except for the necessity of higher daub densities. Other queries for possible hearths and storage pits failed to return any results. Units displaying specified traits of middens, kilns, houses, and burnt houses were given different symbology in order to show the different areas. This model predicted what may lie below the surface of the site. This prediction was compared with the images drawn from the magnetometry, soil chemistry analysis, and the artifact densities found around the excavated areas.
RESULTS
This project began by reviewing the GIS map for the category labeled Other Artifacts which consisted of artifacts like ground stones, cement, metal, lithics, and loom weights. These artifacts were both rare and scattered across the site without an obvious pattern. The rarity of all these artifacts made it impossible to see any pattern or clusters.
The GIS map for the ceramic weights showed a general smear of ceramic materials across the majority of the surveyed area. Concentrations of high weights were found by comparing the weights of each unit surveyed. In regard to the total weight of ceramic sherds found, any unit which had contained over 95 grams of ceramic were considered to have above average concentrations and units with over 188 grams had high concentrations. One large connected ceramic cluster (possibly the result of three large clusters merged together) was located. This cluster stretches from unit S102 to the northern edge of the surveyed area and covered the area of the Block Three excavations. Two smaller clusters were present around the southern part of the site.

Figure 1. This map illustrates the surface ceramic density and distribution of the K-14 site. Each block represents the amount of ceramic found in a particular square meter surveyed. The blue colors in this figure represent above average and high concentrations of ceramic. By looking at the higher concentrations, a large cluster is seen stretching from the northern area to the middle of the site.
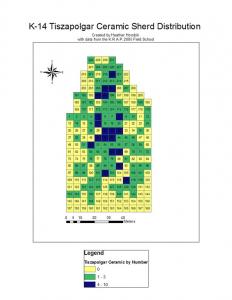
Figure 2. Figure 2 reveals the location and distribution of confirmed Copper Age ceramics on the surface of K-14. Green indicates a presence of Tiszapolgar ceramics while blue indicates a high concentration. The areas of high concentration correlate with the high concentrations of all ceramics seen in Figure 1. The location of the Copper Age ceramics suggests which areas of the multilayered site are Copper Age in origin.
In terms of the amount of ceramic sherds per unit, over ten sherds was considered above average and over 20 sherds was a high concentration (see Figure 1). The clustering of ceramics by the number of sherds corresponds well with the clustering by weight with few differences. The large cluster is obvious but the smaller clusters are less compact.
Additional information produced a new map indicating which surface areas contained Tiszapolgar/ Copper Age ceramics. Of the 231 units surveyed only 124 had confirmed Tiszapolgar pottery (see Figure 2). Units containing four or more sherds of Tiszapolgar pottery were given the label of high concentration. Of those 124 units only 20 had four or more sherds of confirmed Copper Age sherds. These units with high concentrations of confirmed Tiszapolgar pottery corresponded well with the already established clusters of ceramics.
The data on the bone fragments revealed some clustering and high concentrations. The maps illustrating the location of faunal remains reveal that while less common the bone distribution somewhat mimics the distribution of the ceramic clusters. Based on weight per unit, the only large clustering was found in the middle of the site with adjacent high concentrations in units S41 and S53 and units S43, S55, S67. Other high weight concentration occurred within isolated units. Both the adjacent and isolated high concentrations correspond directly with parts of the ceramic clusters discussed above. Weights below 16 grams of bone were considered average and above 16 grams were considered high concentrations.
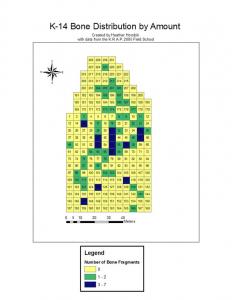
Figure 3. In this figure, the location and distribution of faunal remains are shown. Shown in green and blue, the low amounts of bone indicate a less common artifact on the surface of the site. Still, the distribution pattern can be seen as similar to the distribution of the ceramics.

Figure 4. The above average and high concentrations of daub (burned earth) are shown in blue on this map. The distribution of daub reveals that the majority of high concentrations are in the northeastern areas of the site. These areas may have subsurface features such as burned houses, kilns, and middens.
In regard to the number of bone fragments per unit, the results for high concentration vary slightly (see Figure 3). Any unit with over three fragments was considered an area of high concentration. Three small clusters composed of a few adjacent units of high concentration were located along with five isolated units of high bone concentrations.
The majority of the surveyed area contained traces of daub revealing a general smear of daub across the entire site (see Figure 4). Using the weight of above 170 grams for above average concentrations and 338 grams or more as high concentrations, daub clusters were located. The map revealed that the majority of high concentrations were located in the northeastern part of the site. In comparison to the magnetometry, the daub clusters occurred north of the trenches shown between the outer and middle trench in the northwest area and northeast of the second trench.
After reviewing clusters composed of single artifact categories, the search for clusters composed of different combinations of artifacts was necessary. Comparing the individual maps produced three clusters in which all three main artifact types were present: one large cluster to the north, one large cluster in the vicinity of Block Three, and one smaller cluster near the trenches in the northeast part of the site. The majority of these clusters and all of the large clusters occurred north of the east-west line at 440 north. The artifacts below this line, units S85 through S168, reveal a more general and random smear of artifacts.

Figure 5. Figure 5 is a prediction model based on queries for possible subsurface features. The patterns within the units indicate areas which the computer marked as possible areas with burned house, houses, middens, and kilns. The illustration also shows the results of the magnetometry survey in brown lines and the 2005 excavation sites in labeled brown blocks. This model allows for the comparison of the various types of testing done on the K-14 site.
The final result of this project was the prediction model (see Figure 5). This map attempted to answer questions concerning the features below surface and the effects of agricultural practices on the site. This model displayed areas the queries revealed as possible subsurface features. Units that fit the house area characteristics covered the southwestern areas while burned house characteristics are found toward the northeastern part of the site. Also the six possible kiln areas were found on the northern half of the site. Midden areas also appeared in the center, near the southwest part of the second trench, around the northwest part of the trenches, and to the north.
DISCUSSION
The purpose of this research was to evaluate the reliability of site survey in gathering information about a site and making predictions about the subsurface site through artifact distribution. Hypotheses were created using knowledge of site disturbances and patterns found in the GIS maps. The maps and prediction models were then compared to the magnetometry, soil chemistry, and 2005 excavations results to find any correlations. Many conclusions about the layout and disturbances of the K-14 site were made in regard to this research.
The category labeled "other artifacts" provided few insights into the site. Due to the rarity of these artifacts, high densities and clusters did not exist. Of these artifacts, the metal and cement were not Copper Age in origin. The two pieces of cement found on the eastern side of the site revealed recent disturbances to the site. The cement was possibly deposited during the construction of the adjacent Dió-Éri canal just east and northeast of the site. This discovery allows the possibility that artifacts in the eastern/northeastern areas also may have been redeposited during the canal construction. The cement placement suggests that the distribution has been disturbed by human activity and therefore any hypotheses should be considered with this disturbance in mind.
The ceramic analysis reveals large areas beneath the subsurface near the middle of the site with high concentrations of ceramics as well as a few small areas of high concentrations of ceramics. The largest cluster of ceramics is located above Block Three where a large Sarmatian pit (shown in the magnetometry as a circular feature) was discovered during excavation. This post-Copper Age pit is an example of human disturbance of Copper Age materials. To create the pit, dirt and cultural material were removed from their context in the ground and redeposited throughout the area. This pit and its resulting redistribution of artifacts could be partly responsible for the large concentration of not only the ceramics but other artifact concentrations within the cluster.
Difficultly arose when analyzing faunal remains for information on the Copper Age. The bone fragments were not dated and, as all other artifacts found in the survey, lacked context. There was a spatial correlation between the bone clusters and the Tiszapolgar ceramic clusters in the same areas. This resulted in our analysis being based on the uncertain assumption that all bones originated from the Copper Age. Copper Age faunal remains were produced during the butchering and eating of both domesticated and wild animals. Given the lack of stone in the area, bones could be formed into tools and possibly weapons. The KRAP 2005 excavations have supported this by the discovery of bone tools in Block Five.
The final individual map analyzed was the daub distribution map. The presence of daub could reveal locations of hearths, kilns, burned houses, or dump areas. That daub appears outside the areas in which the magnetometry showed possible house structures and that daub concentrations appeared in the trench areas raised questions. One hypothesis for daub being in the trenches is that it is the remains of a burnt wall or stockade. While the presence of postholes inside the inner trench (found during excavations of Block Five) supports that hypothesis, only small amounts of daub were found in that area during the survey. Another hypothesis is that the trenches were used as middens. This is supported by the excavations of a midden located in and over the inner trench in Block Five. In regard to the predicted burned houses in the Northwestern trench area, one explanation is that some material was redeposited during the construction of the canal. The presence of the canal and the discovery of the cement and metal of the site hold the possibility that the site or the Northwestern section may have been disturbed.
The prediction model was created to be compared to the magnetometry results. Although magnetometry is not always reliable, the K-14 magnetometry data has proved to be accurate in the previous excavations. If correct, magnetometry shows what is actually below surface: a series of three concentric trenches which surround house structures and a large number of pits or hearths (see Figure 5). By comparing the magnetometry layer and the prediction layer, it is obvious that the two do not correlate well. Focusing on the midden predictions, particularly the one in Block Three, showed that the artifacts may have drifted from their original locations by about one unit south/southwest. The midden comparisons suggested that the affects of plowing were minimal to the spread of artifacts on the surface. House and burned house areas appeared more spread out and randomly smeared when compared to the magnetometry. This may be due to small amount of information available to base the house queries on.

Figure 6. The results of the soil chemistry test can be seen in this figure. Yellow, orange, and red reveal the locations of the highest amounts of phosphates in the soil. Phosphates are important to this project because phosphates are released into soil during the decomposition of organic materials. Areas high in phosphates may reveal Copper Age middens or livestock areas.
The soil chemistry analysis showed interesting correlations with the other data sources. The K-14 results (see Figure 6) were based on the phosphate weights found within the soil samples taken from the site. Phosphates are released into the soil during the decomposition of organic materials with traces remaining within the soil for centuries. These properties make phosphate analysis a wonderful tool for discovering ancient trash and livestock areas.
Higher levels of phosphates appeared throughout the site with a prominent area of high concentration situated in a southwest to northeast diagonal within the interior of the site. Within this diagonal area was a large area of the highest concentration of phosphates within the soil. The concentration covered one magnetometry appointed house cluster and spread into the Northwestern trench area. This was the same area with the higher concentrations daub that was predicted to be burned houses. As before, the location of the high concentrations cautioned against making any inferences due to the proximity of the canal.
Other areas of higher concentrations of phosphates appear to be within the trench areas or outside the trenches. This suggests that the organic materials were thrown into the trench areas or outside the enclosed site, and that most of the livestock stayed outside the trenched areas. The high concentrations of phosphates within the house structure area, if not associated with the canal may however, be evidence that livestock or organic materials were allowed within that particular area. In addition, the areas of high phosphate concentrations correlated to some extent with predicted middens, with the midden areas appearing north of these phosphate concentrations. This directly contradicted the earlier observation that the artifacts drifted south/southwest from their original locations.
The area of the site had been heavily plowed. From literary research, it was known that plowing moves artifacts a few meters. While concentrations appear, one can not be positive that subsurface concentrations are underneath that particular area or are of the magnitude suggested by the surface scatter. Comparing the magnetometry results and excavation data to the survey data suggested that plowing may have moved the artifacts less than what was first believed. The artifacts as a whole may have been moved in the same direction only about one unit. However, as stated above, the phosphate analysis appeared to contradict those findings by indicating a greater displacement of artifacts in the opposite direction.
Based on more literary research, another possibility is that the clusters seen from the 2005 surface data may just be random clusters caused by the random cycling of artifacts in the plow zone. Even if the artifacts did not move and the clusters represent true subsurface concentrations, the surface artifacts still lack context. This lack of context makes it nearly impossible to use rarer artifacts to form any hypotheses. One artifact is more likely to be further from its original context than a large quantity of artifacts in a cluster. Context is important in making assumptions about sites and this survey has shown how hard it is to do so without context. The lack of context and possible movement of artifacts must remain in mind while making conclusions about the site.
Another problem experienced was the lack of exact ages on the artifacts. Since one purpose of this case study was to form a picture of a Copper Age site, having little information on the dates of artifacts made the interpretation of the site more difficult, especially as the site had obviously been disturbed and used since then. Without ages assigned to many of these surface artifacts, the analysis may be skewed. This lack of ages is why the ceramics are so important to the research. The ceramics can and have been recognized as Tiszapolgar by their style. Some of my analysis relies on the spatial relation of Tiszapolgar ceramics to the bone clusters. Unfortunately, excavations in Block Three have shown other period ceramics to be deposited by Tiszapolgar pottery, so this method of assigning periods by spatial association is not totally reliable itself. Artifacts without distinctive style or other age indicators will always be at risk of being misassigned and misinterpreted.
The K-14 site has a complex history which complicates drawing conclusions for the Copper Age. Many groups have occupied and used the land, most recently a farmer for agricultural purposes and the government to build a canal. The canal has affected the eastern side of the site and perhaps could account for the clustering of artifacts to the north of the site. The area north of the site was not surveyed by Dr. Apostolos Sarris during his magnetometry research and therefore it is difficult to rule this out (Sarris 2004). However, after comparing the clustering of the artifacts to the north and the lack of any major clustering on the affected east side, other features could be found in the northern area. The clustering appears to be more comparable to the clustering around Block Three. The Block Three clusters are very good signs of significant subsurface features.
CONCLUSIONS
The final results in the analysis of the K-14 surface artifact data, while limited, did reveal some information about the site and what may lie beneath the surface. By using and creating various data tables, shapefiles, layers, and maps, a visual representation of the site was created. These map documents allowed the distribution and density of different types of artifacts to be seen. While this project was not as successful as hoped, it establishes certain steps and data qualities needed for other archaeologists interested in analyzing surface data through GIS. Due to the complexities involved, survey is not particularly effective in interpreting surface artifact distributions when used alone, but is a useful tool when trying to gain basic knowledge of a site on which other methods will be used.
Due to the focus and fast pace of the field school and this project, there was less time and information than this project truly requires for in depth research and as a result many things could improve this project. Much of that involves better information which can be gathered through further analysis of the surface artifacts, through repeated full coverage site surface surveys, and through further excavation of the site. Other surveys should be conducted after the site has been replowed and the results compared to this survey in order to see if the artifact clusters and patterns still exist. The continuous cycling of artifacts in the dirt may have created random clusters rather than clusters which reflect the subsurface site. Finally, further testing of the land directly to the north is suggested. Discovering what is to the north and whether those artifact clusters are another part of the site, a later site, or just artifacts redeposited by the canal construction would be beneficial. Magnetometry if not excavation should be conducted in that area. Further excavations at the site will also aid in the analysis. By increasing knowledge of the site a more accurate portrayal of the subsurface could be presented.
The complexities and problems experienced in the analysis of surface remains of the K-14 site demonstrate how difficult interpreting data from site surface surveys can be. Archaeologists need to account for the possible displacement of artifacts over time and for the factors that can skew the results. Usually, a single survey cannot provide significant information on a site by itself. Only basic information can be trusted on this basis. To find more in-depth information, other archaeological methods should be used in conjunction with the site surface survey. Any interpretation based on surface survey has the potential to be off if only due to the complexities of the site and the survey. Archaeologists do not work in controlled environments and uncertainty must be accepted. That a perfect understanding is impossible to achieve should not and does not prevent attempts to recreate and understand history better. There is a reason why archaeologists use a variety of methods to reach their conclusions. Different methods present different types of information and when used in combination present a clearer picture. The analysis of the full coverage systematic site surface survey data from K-14 proves this. Using the magnetometry, soil chemistry analysis, and excavations made the analysis and conclusion of the site much stronger than it would have been using survey alone.
ACKNOWLEDGEMENTS
I would like to thank everyone who helped me on this project by providing me with this opportunity, giving me advice, reading drafts, and sending me data. Specifically, I would like to thank all the KRAP 2005 participants and leaders for working with me, encouraging me, and sharing data, maps, and knowledge. I would also like to thank the NSF for the REU grant which allowed me to travel over seas to experience this wonderful research opportunity.
REFERENCES
Ammerman, Albert J. (1985) Plow-Zone experiments in Calaberia, Italy. Journal of Field Archaeology Vol. 12, No. 1, Spring, 33-40.
Parkinson, William A. (1999) The Social Organization of Early Copper Age Tribes on the Great Hungarian Plain, Ph.D. Dissertation. University of Michigan, Ann Arbor.
Parkinson, William, Richard Yerkes, and Attila Gyucha (2004) The Transition to the Copper Age on the Great Hungarian Plain: The Körös Regional Archaeological Project Excavations at Vészto-Bikeri Hungary, 2000-2002. Journal of Field Archaeology. Vol. 29, Nos. 1 and 2, Spring and Summer, 2002-2004: 101-121.
Renfrew, Colin and Paul Bahn, (1991) Archaeology: Theories, Methods, and Practices, Thames and Hudson Ltd., London.
Sarris, Apostolos, (2004) Technical report: Geophysical Prospection Survey at Körösladany 14-Visztu, Hungary (2003). Laboratory of geophysical- Satellite Remote Sensing & Archaeo-Enviroment of the Institute for Mediterranean Studies Foundation of Research & technology, hells (FORTH).
Shott, Michael J. (1995) Reliability of Archaeological Records on Cultivated Surfaces: A Michigan Case Study. Journal of Field Archaeology Vol. 22, 475-490.