

Author: Sharon Lin
Institution: The IMEDIA Academy, Providence, RI
Date: July 2007
ABSTRACT
Informal educational centers, such as museums and public aquaria, have looked towards interactivity as one way to make their exhibits more attractive and informative. In some institutions, such as aquaria, direct interaction with most of the specimens is impractical. However, touch-screen information systems may become an effective way to introduce interactive experiences to visitors. In this paper, we evaluated the effectiveness of these interactive interfaces against printed posters in improving the entertainment and educational value on aquarium exhibits. By conducting a user study at the Mystic Aquarium, we found that Interaction Panels outperformed posters in attracting users, especially children. Through self-reported measures, Interaction Panel users felt they spend more time at the interface than did poster users and both users perceived similar levels of learning and enjoyment. Both users of the Interaction Panel and posters also tended to report learning more about the exhibit than non-users. Future studies can be extended into three areas: extending the use of the panel in other museums and informal education centers, using the Web to extend the interactive experience beyond the visit, and tailoring interactive interfaces to encourage involvement from children and their parents.
INTRODUCTION
Informal educational centers, such as museums and public aquaria, serve as important sources of inspiration and life-long learning for the general community. Museums are vast resources that communicate a nation's culture, history, and identity. Aquaria bring ocean life to the surface and increase public awareness about an important resource on which we all depend and help people experience places and environments that impact us all but are beyond the scope of our everyday lives.
However, ever since museums and other informal education centers opened their doors to the public, their roles have expanded to include recreation. Even though many visitors come to museums with the expectation to learn new things, their primary reasons are most often social (Weil 2002). These reasons may include spending time and having fun with family, friends, and loved ones. In order to reach their full potential as an important community resource, it is vital that museums, aquaria, and other informal education centers be seen as not only educational but also enjoyable places to visit.
One method of addressing this challenge is introducing highly interactive exhibits, which not only help attract visitors but also helps museums fulfill their educational mission. Interactive exhibits and their role in museums have become an interesting area of research. Studies in Virtual Reality exhibits have indicated that interactivity has a positive impact on visitors' enjoyment and engagement with the exhibit (Roussou 1999). A study by Belloti et. al. (2002) on the effects of multimedia handheld guides at the aquarium also finds a positive relationship between visitor satisfaction and interactivity. Visitors who used the handheld device tended to report more satisfaction than visitors who just viewed informational panels at the exhibit. Simple tactile interaction also tends to have a positive effect in invoking visitor curiosity (Koran 1984). When the option of touching the exhibited objects was introduced in a museum exhibit, more visitors were attracted to the exhibit than when the same objects were presented but without visitors having the option to manipulate them. These findings support the movement towards more hands-on exhibits in museums to attract visitors.
In addition, work in cognitive science has shown a strong relationship between factors such as personal and emotional significance and the amount of elaboration with long-term memory retention and retrieval (Given 2002, Schenck 2003). The more a visitor is actively engaged and interested in an exhibit, the more likely the exhibit will induce understanding and long-term memory. A study by Lindemann-Matthies and Kamer (2000) at a Swiss zoo has also shown that visitors having interactive experiences with touch tables and dialogue with rangers tended to know more about the concepts presented compared to visitors that only gained information from labels and posters, even after two months.
However, introducing interactive experiences is still a challenge for many informal education centers, in particular public aquaria. In the case of aquaria, direct interaction with specimens is limited to designated touch tanks and sometimes larger marine mammals. The other specimens must be protected from visitors and vice versa. In addition, many aquariums use printed, graphical panels to present information on the fish tanks. Although graphical panels are standard ways of communicating information in the aquarium, they have several limitations. First, they are static and offer no interaction. Second, the space and time needed to present information limits the amount that can be provided. Third, identifying specimens can be difficult because the panel is separate from the exhibit and can only show generalized representations of the specimens in the tank. Last, the information is the same for all visitors and it is difficult to accommodate for differences in visitor interests. For these reasons, the majority of fish and invertebrate tanks still remains a passive viewing experience. The question then becomes how to introduce the benefits of interaction to the aquarium, where direct interaction with specimens is not possible. This project explored the potential of using touch-screen interfaces to open new opportunities for interactive experiences in the aquarium.
The aim of this research was to evaluate the effectiveness of interactive interfaces, in terms of education and entertainment, in an aquarium setting. This part would be achieved through conducting a user study on a touch-screen interface developed by IMEDIA at the Mystic Aquarium, in Mystic, Connecticut (http://www.mysticaquarium.org). The study explored the effect of the interface on how much visitors feel they learned and enjoyed their experience at one of the fish tank exhibits. To identify possible areas for improvement, questions regarding who used the interface, its usability, visitor motivation for using the interface, and whether visitors would be interested in having the interface online were also addressed. Finally, the study compared the interface's effect to that of printed panels, a more standard educational method.
METHODS AND MATERIALS
Interaction Panel
The research described in this paper was conducted within the context of the Interactive Aquarium project (Stephenson et. al. 2005), an ongoing project that uses public aquaria as a case study to develop systems for promoting interactivity and learning in public spaces where direct interaction with specimens is limited. This research focused on one interface developed in the project, the Interaction Panel as shown in Figure 1. The Interaction Panel is an interactive interface written with ActionScript 2.0 and Flash 2004 MX. It uses dynamically bound XML content to reconfigure the information in the interface. The panel sits next to the aquarium and works as a touch-screen kiosk serving the same function as a graphical information panel. However, unlike static information panels, the Interaction Panel interface allows visitors to interact with the specimens indirectly through a touchable video of the fish tank. Visitors can touch any fish or coral in the video and look up information on the selected specimen. By touching the navigational buttons, visitors can also access additional information on the location, diet, and fun facts about each specimen. In addition, they can locate specimens in the video by selecting it from a picture menu underneath.

Figure 1: The interface of the Interaction Panel developed within the Interactive Aquarium project
The Study
The user study was conducted over nine days from September 6th to the 14th 2006 at the Mystic Aquarium & Institute for Exploration. Located in Connecticut, the Mystic Aquarium is home to more than 3,500 marine creatures and 34 exhibits. The public, non-profit aquarium receives up to 5,000 visitors a day during the summer and up to about 1,000 visitors per day the rest of the year.
Our study focused on one of the popular coral reef tanks at the aquarium. A large graphical panel on conservation surrounded the tank. However, there was no existing information on the tank inhabitants at the exhibit.
For the first four days of the user study, the Interaction Panel was set up near the tank as shown in Figure 2. A sign with a basic explanation about touching the video or buttons to learn more about the fish and coral in the tank was placed above the screen. For the next four days, the touch screen was turned off and printed posters were put on the walls in the same general location (Figure 3). The information and pictures on the posters were taken directly from the Interaction Panel, but due to space limitations, some coral and plant specimens and pictures were not included. In total, 12 out of 16 specimens in the panel were transferred to the posters. Each educational tool, the interface and the posters, was used over three weekdays and one day over the weekend.

Figure 2: The placement of the interaction panel beside the aquarium. (Not to scale)
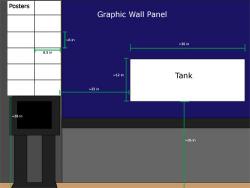
Figure 3: The placement of the posters beside the exhibit. (Not to scale)
The user study was conducted in two sections,observing exhibit visitors and surveying exhibit visitors. The author was responsible for taking observations and conducting the surveys. For the first part, an hour in the morning and afternoon of each study day was set aside to observe visitors. A count of the number of visitors who stopped at the exhibit and those who used the information panels was noted. Visitors were grouped into two categories, either children under 18 or adults, based on appearance. In order to identify people as having visited the exhibit, we considered stopping and looking at the exhibit for at least five seconds to be sufficient requirements. Similarly with the information panels, stopping in front of the panels and looked at them for at least five seconds was considered sufficient to have used the panel.
For the second part of the study, visitors were surveyed after they had finished visiting the tank and were walking away from the exhibit. Very small children were excluded from the survey. Participants were given one of four different surveys depending on whether and which panels they used. These four groups were:
1. Visitors who used the interface
2. Visitors who did not use the interface
3. Visitors who used the posters
4. Visitors who did not use the posters
As the study progressed, we noticed that several visitors who did not use the touch panel reported that they did not notice it in the surveys. Therefore the touch screen was moved closer to the tank and the interface was put on the screen for the last day of the study to see whether increased proximity to the tank would affect visibility of the panel and the number of users.
Survey items
All four surveys contained closed-ended questions that allowed for quick completion. Check boxes were used on questions regarding visitor motivation, while a five-point Likert-style scale format was used for questions regarding visitor's time using the posters or panel, their engagement, enjoyment of the exhibit, usability of the vehicle used, and perceived learning. The scales ranged from very negative to very positive, with higher numbers being more positive.
A quiz on the content on the posters and interface was also considered as a measure for learning, but the idea was dropped due to time considerations. Because learning is influenced by many other factors, such as the visitors' background and prior knowledge, these would need to be assessed in order to make a direct measurement of learning. Using a quiz for a self-directed learning system, such as the Interaction Panel, would also be difficult because it has a large amount of information but no set curriculum. Instead, the survey asks how much visitors feel they learn from using the interface or the posters to get an indication of the interface's effect on visitor's perceived learning.
Visitors who used the interface were also questioned about their interest in having the Interaction Panel interface online as part of the aquarium website. This question was included to indicate the potential of using the interface to extend the aquarium experience beyond the actual visit.
RESULTS
Usage and Visitor Composition
We counted the number of visitors to the tank through observations. Contingency table analysis with chi-square tests were used to examine whether the presence of either the Interaction Panel or posters had an effect on usage and whether there is any relationship between age and panel usage. The results are shown in Table 1.
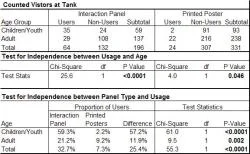
Table 1: The top part of Table 1 shows the age group breakdown of the exhibit visitors and how many used the given information source. The rest of the table shows the results of the chi-square tests for independence between usage of the information source and age and between source type and usage. The statistic reported is the Yate's chi-square corrected for continuity. Bolded statistics indicate significance with a p value of less than 0.05
From this testing, we found a significant relationship between the type of information source presented and its usage. There were a greater proportion of visitors to the exhibit who used the interface than the proportion who used the posters. For both children and adults who visited the exhibit, a greater proportion used the Interaction Panel compared to the proportion of those who used the posters. Age also has an association with the type of information source used. Children were more inclined to use the Interaction Panel than adults, while adults were more inclined to use the posters than children.
Motivation
A total of 223 surveys out of 322 distributed were collected from visitors over the eight-day period. Table 2 shows the gender and age composition of the groups of visitors surveyed. From the surveys, visitors in the study were asked about their motivations for using the Interaction Panel and posters (Table 3). More than one option could be chosen. The number one motivator for visitors using the interface was because it looked like fun (56.5%), and learning about the fish tank was a close second (50.0%). On the other hand, visitors who used the posters mostly wanted to learn about the fish tank (82.4%), and a smaller percentage felt that reading the posters looked like fun (8.8%). Participants who just visited the tank were asked about their reasons for not using the interface or posters (Table 3). They could choose more than one answer. A large proportion of visitors reported other reasons (32.8% of interface nonusers and 24.2% poster nonusers). For interface nonusers, these other reasons comprised of mostly of not noticing the Interaction Panel (26.2%). For poster nonusers, other reasons comprised mostly of kids moving (8.8%) and not noticing the posters (20.6%). The reasons visitors stopped using the interface and posters were also reported (Table 3). For the Interaction Panel, the top reasons were that visitors claimed they read everything (21.0%) and other reasons (29.0%). The other reasons comprised mostly of time restrictions (8.1%), kids (11.3%), and the visitors' group moving (4.8%). For posters, the top reasons were again that visitors claimed they read everything (38.2%) and that there was nothing else they wanted to read (26.5%). Other reasons not listed comprised of time restrictions (5.9%) and kids moving around (5.9%).
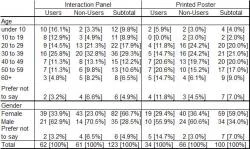
Table 2: This table shows the age and gender breakdown of the surveyed participants
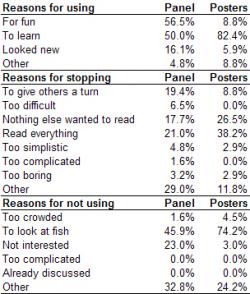
Table 3: This table shows the reasons provided for using, stopping use and ignoring the interaction panel and posters and their frequencies as given by the survey results
Affection, Learning, and Usability
Table 4 summarizes the mean Likert scores that exhibit visitors reported in the survey for entertainment, interest gain, time spent, and usability of the Interaction Panels and printed posters. Two-tailed t-tests and single factor ANOVA tests were conducted to evaluate differences in the scores between the four groups of visitors. The threshold for significance was set at 5%. Additional single factor ANOVA tests were run to evaluate differences in learning and enjoyment scores between different age and gender groups. However, there were no significant differences between age and gender groups in how highly they rated learning and enjoyment.

Table 4: This table shows a summary of the mean Likert scores reported for each area. The table also shows the results of chi-square tests for independence between the type of information source presented and the survey scores. Single-factor ANOVA tests were used when comparing all four groups. Two-tailed t-tests were used when comparing only two groups. Bolded statistics indicate significance with a p value of less than 0.05
Entertainment
Within all groups, visitors generally enjoyed their experience at the fish tank and there were no significant differences between how highly the different groups of visitors rated their visit to the tank. Both Interaction Panel users (mean = 4.02) and poster users (mean = 3.93) reported that they were more interested in the exhibit after viewing information presented in the panels with no significant differences between the amount of interest gain.
Engagement
Time spent using the information sources was reported by visitors on the surveys using a five-point scale, with one corresponding to less than a minute and five corresponding to more than fifteen minutes. From the survey results, all four groups of exhibit visitors reported spending the same amount of time at the tank. However, Interaction Panel users reported spending significantly more time (mean = 1.85) using the interface than poster users did using the posters (mean = 1.59).
The ways visitors interacted with the panel and posters were also surveyed (Table 5). Visitors could choose more than one answer. The majority of visitors using the interface touched the video to learn more about fish (74.2%). Fewer made use of the navigational buttons, including ones that categorized the content into general information, diet, location, and fun facts (32.3%). A small percentage of visitors just glanced at the panel (12.9%).

Table 5: This table shows the tasks performed at each of the two types of information panel and their frequencies as given by the survey results
Learning
The five-point Likert scale used to measure learning ranged from did not learn anything (corresponding to a one) to learned very much (corresponding to a five). Both users of the Interaction Panel (mean = 3.03) and posters (mean = 3.10) reported learning an average amount with no significant difference measured between the two groups. There was a significant difference between the groups that used an information source and those that did not. Visitors who used the information sources reported learning more at the exhibit than visitors who did not use the information sources. The visitors that ignored the posters felt like they had learned little (mean = 2.11) and those that ignored the Interaction Panel, less than average (mean = 2.63).
Both groups who used the information sources were interested in learning about other exhibits in the aquarium (interface mean = 3.83, posters mean = 3.53).
Usability
A similar five-point Likert scale was used to measure usability, ranging from very difficult to use (corresponding to a one) to very easy to use (corresponding to a five). General observations were also noted. There was some confusion among younger children about what the interface was and how to "play the game." They would generally need to rely on their parents to explain the interface. Also, the three older visitors (above 60) in the sample tended to feel that the interface was more difficult to use (mean = 2.3). Still, visitors who used the Interaction Panel felt that interface was easy to use overall (mean = 4.12), and there was no significant difference between the usability of the posters (mean = 4.07) and that of the interface.
Online
Interface users were asked whether they would use the interface if it was part of a website. Overall, users leant towards using the online version of the interface, with a mean rating of 3.81 out of 5.
DISCUSSION
Our user study at the coral reef tank presented several interesting results. First, the Interaction Panel attracted more users in absolute terms and in proportion to non-users compared to the printed posters, allowing information about the exhibit to be spread to more visitors. Our results show that both children and adults were more inclined to use the Interaction Panel than the posters. In addition, while the posters attracted visitors who were more interested in learning about the exhibit, the Interaction Panel attracted both visitors who wanted to learn and visitors who wanted to have fun. This makes sense since the interface offers tactile interaction with video and buttons in addition to the standard pictures and text. Children under 10 were especially delighted with these interactive elements and would make a game of "tagging" the fish in the video. Although young children usually did not understand the interface, they tended to lead their parents to the panel and invoke their help in explaining the interface and reading its content out loud.
Second, both Interaction Panel users and poster users reported a higher perceived learning effect compared to non-users. On the other hand, the perceived learning effect for both the Interaction Panel and poster users was similar. One possible reason is that the Interaction Panel users and the poster users had different motivations for using their respective information sources. It is possible that these initial expectations may shape the way each user perceives learning, and using self-reports may not be sufficient to differentiate between the two types of information sources. A more in-depth study, perhaps using quizzes or open-ended questions, is needed to better examine whether interactive interfaces encourage learning more effectively than posters for each user. In addition, our results showed that the time Interaction Panel users reported spending at the interface was longer than the time poster users reported spending at the posters. Because these measures are self-reported, however, more objective measures such as timing the visitors should be also employed in the future to see if there are changes in the result patterns and to better ascertain this relationship.
Third, visitors perceived similar levels of enjoyment regardless of whether they used the information sources or not. One potential reason for this result is that visitors are free to choose which exhibits they would like to visit and the majority of visitors are already looking to have fun (Weil 2002). Thus, any additional enjoyment value that the information sources may have to offer may be negligible in comparison to the innate enjoyment of an aquarium visit.
Fourth, most visitors found the interface easy to use, and usability remained relatively the same for all age groups except where it dropped in the 60 years and above range. The results indicate that the interface may be more difficult to use for visitors in this age range. During the course of the study, it was also apparent that the navigational buttons separating information into the categories general, diet, location, and fun facts often went unnoticed and were not frequently used. However, this may mostly be a design or instructional issue for this particular interface studied.
Finally, we suggest some improvements for the Interaction Panel. Although the Interaction Panel tended to engage many more visitors compared to printed posters, its usage rate is still low at around 32%. The most frequent reasons reported were that visitors just wanted to look at the fish and that they did not notice the panel. The position of the interface was not main problem, as even after the panel was moved closer to the tank, the usage rate did not visibly improve. It is also possible that there was some misunderstanding about the purpose of the interface that contributed to this low usage. Visitors are used to using graphic panels as sources of information, and may not expect an informational touch panel to be near the tank. Many people, including adults, also thought the interface was a game or just a video at first glance. In these cases, a public announcement and demonstration of the Interaction Panel at the aquarium may be useful in increasing visitor awareness of the system.
Another important reason for low usage might be that the panel is more of an individual rather than group activity. Museum going is largely a social outing. Visitor groups tend to move together and do similar activities, and although more than one visitor can touch the screen and read the information at a time, the panel is not conducive to work well with groups. Several visitors have noted that they stopped using the panel because their group or kids moved to another exhibit. There were also several instances where children would crowd around the touch screen trying to interact with the video at the same time. Studying how to expand the Interaction Panel to allow for more people to participate and whether this makes a difference in usage would be interesting. A few visitors suggested a larger screen.
CONCLUSIONS
In order to make use of their potential as an important community resource and fulfill their educational mission, informal education centers often look towards interactivity in order to make their exhibits more attractive to visitors and prompt more engagement in learning. Some types of centers however, particularly public aquaria, have a difficult task to introduce interactivity to their exhibits because direct interaction with specimens is usually impractical or inadvisable. Therefore we decided to study the use of an interactive panel as a means to present information as an alternative to static printed posters. The Interaction Panel has several advantages in our opinion. It uses little space and more information that can be tailored and easily maintained and updated. It also permits interactive activities and games.
We conducted a user study at the Mystic Aquarium and found that interactive interfaces such as the Interaction Panel attract more visitors, particularly children, when compared to traditional print methods. Both Interaction Panel and poster users also reported a higher level of learning than non-users. Although there were no differences in the reported levels of learning between Interaction Panel and poster users, Interaction Panels have potential to increase overall education about the exhibit by exposing the information to more users. Given its friendly usability, interactive interfaces can be successful tools for delivering information to users and have potential to increase the educational value of an aquarium visit.
Further research in the effect of these interfaces on visitor learning and enjoyment in the aquarium should take into consideration the influences of different exhibits and audiences. Methods other than self-report measures should also be employed to see if there are any variations in the results. Future studies can also explore the potential of using similar interfaces in other informal education centers, such as history and art museums. For improving the panel, we suggest looking for ways of expanding it to better accommodate group participation and see whether it affects visitor usage. As a final thought, visitors' general interest in using the interface over the Internet indicate that it may be promising to study how putting similar interfaces online can extend the aquarium experience beyond the actual visit. Expanding visitor experiences at informal education centers into day-to-day life can help these institutions develop stronger ties with the general community and increase the opportunities for inspiration and life-long learning.
ACKNOWLEDGEMENTS
This material was supported in part by the National Science Foundation under Grant No. 0353786. I would like to thank Pedro Branco, Joan Peckham, my supervisor Peter Stephenson, and everyone else involved in the REU program for helping me along the research process. I would also like to extend a big thank you to the Holt family who helped me to and from Mystic Aquarium during the study and the staff at the Mystic Aquarium who helped make this study possible. Finally, I would like to thank all the aquarium visitors who participated.
REFERENCES
Bellotti, F. et. al. (2002) User Testing a Hypermedia Tour Guide. IEEE Pervasive Computing 1.2, 33-41.
Czyzewicz, S. et. al. (2005) Personalizing the Visitor Experience Using Dynamic Information Systems, in Proceedings of Training, Education, Simulation International (TESI 2005), paper 5C.2.
Falk, J. H. and Adelman, L. M. (2003) Investigating the Impact of Prior Knowledge and Interest on Aquarium Visitor Learning. Journal of Research in Science Teaching 40.2, 163-176.
Given, B. (2002) Teaching to the Brain's Natural Learning Systems. Alexandria: ASCD.
Koran, J. J. et. al. (1984) Attention and curiosity in museums. Journal of Research in Science Teaching 21.4, 357-363.
Lindemann-Matthies, P. and Kamer, T. (2006) The Influence of an Interactive Educational Approach on Visitors' Learning in a Swiss Zoo. Science Education 90.2, 296-315.
Roussou, M. et. al (1999) Learning and Building Together in an Immersive Virtual World. Presence 8.3, 247-263.
Schenck, J. (2003) Learning, Teaching, and the Brain. Thermopolis: Knowa Publishing.
Stephenson, P. et. al. (2005) The Interactive Aquarium: Game-based Interfaces and Wireless Technologies for Future-Generation Edutainment, in Proceedings of Training, Education, Simulation International (TESI 2005), paper 5C.1.
Weil, S. (2002) Making Museums Matter. Washington, DC: Smithsonian Books.